ttop — System Monitoring with History and Notifications
Familiar situation: the server suddenly froze, and you can't figure out what happened? Standard tools like top or htop show only the current state, but don't provide historical context. ttop solves exactly this problem — a monitoring tool with history viewing capability and a flexible notification system.
How ttop is better than familiar tools?
The main difference of ttop from similar tools is saving historical data. While htop shows only the current system state, ttop:
- Saves snapshots via systemd.timer or crontab
- Allows scrolling through change history
- Builds ASCII graphs for trend visualization
- Supports triggers for notifications
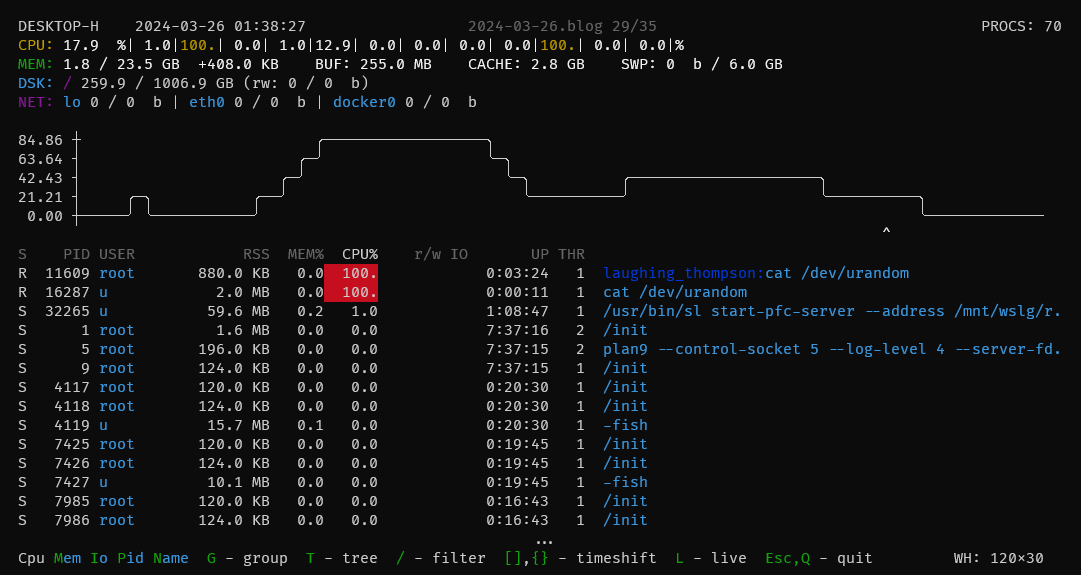
Key Features
-
Historical Data
- Viewing system state at any point in time
- ASCII graphs through asciigraph integration
- Ability to find the moment of load spike and study it in detail
-
Flexible Triggers
- Configuring notifications via external scripts
- Support for Telegram, email, and other channels
- Different trigger types: for critical events and informational
-
Rich TUI Interface
- Highlighting critical values
- Grouping processes by programs
- Filtering: by users (
@user), docker containers (#container) - Execution thread tree
-
Easy Installation
- Ready packages for Arch Linux (AUR)
- Static binaries for x86-64
- Doesn't require root rights to work
How does it work technically?
ttop is written in Nim — a modern statically typed programming language. The project uses:
- systemd.timer/cron for data collection
- asciigraph for visualization
- Docker API for container monitoring
The trigger system passes data to external scripts via stdin with a set of environment variables:
TTOP_ALERT=true/false  # признак критического события
TTOP_HOST             # имя хоста
TTOP_TYPE             # тип события (alert/info)
Practical Use
-
Post-factum Problem Analysis In the morning you discovered that the server "went down" at night? With
ttopyou can review history and find the exact moment of the problem. -
Automatic Notifications Configure sending to Telegram when CPU load is critical or memory is low.
-
Docker Container Monitoring Quickly find "greedy" containers using the
#containerfilter. -
Trend Analysis ASCII graphs help visualize periodic load spikes.
Example of configuring notifications in Telegram
[[trigger]]
on_alert = true
cmd = '''
read -d '' TEXT
curl -X POST \
  -H 'Content-Type: application/json' \
  -d "{\"chat_id\": $CHAT_ID, \"text\": \"$TEXT\", \"disable_notification\": $TTOP_INFO}" \
  https://api.telegram.org/bot$TELEGRAM_BOT_TOKEN/sendMessage
'''
Is it worth trying?
ttop is especially useful for:
- System administrators
- DevOps engineers
- Developers working with resource-intensive applications
- Everyone who needs more advanced monitoring than
top
The project is actively developing, has open source code (MIT License), and has already collected over 350 stars on GitHub. If you regularly face the need to analyze system load, ttop could become your new favorite tool.
How to install?
For Arch Linux:
yay -S ttop
For other systems (static binary):
curl -LO https://github.com/inv2004/ttop/releases/latest/download/ttop
chmod +x ttop
mv ttop ~/.local/bin/
Try it — and you'll look at system monitoring in a new way!
Related projects