Getting the Most Out of Training Logs with LiftShift

If you go to the gym and carefully log every set in Hevy, Strong, or Lyfta, you've probably noticed one thing. Mobile trackers are great at collecting raw data but almost never help you make sense of it. At best, the app shows a graph of one exercise over a month and congratulates you on a new one-rep max. The real problem is that it's hard to see which muscle groups you're consistently undertraining, where you've hit a genuine plateau and need to change your approach, and what's just normal fatigue from the third set.
I recently discovered the open-source project LiftShift. It's a web tool for deep analysis of training logs that runs directly in the browser and requires no registration.
What the project can do
The core idea is simple: you feed the app your export or connect your account, and it organizes your workouts from a sports periodization perspective.
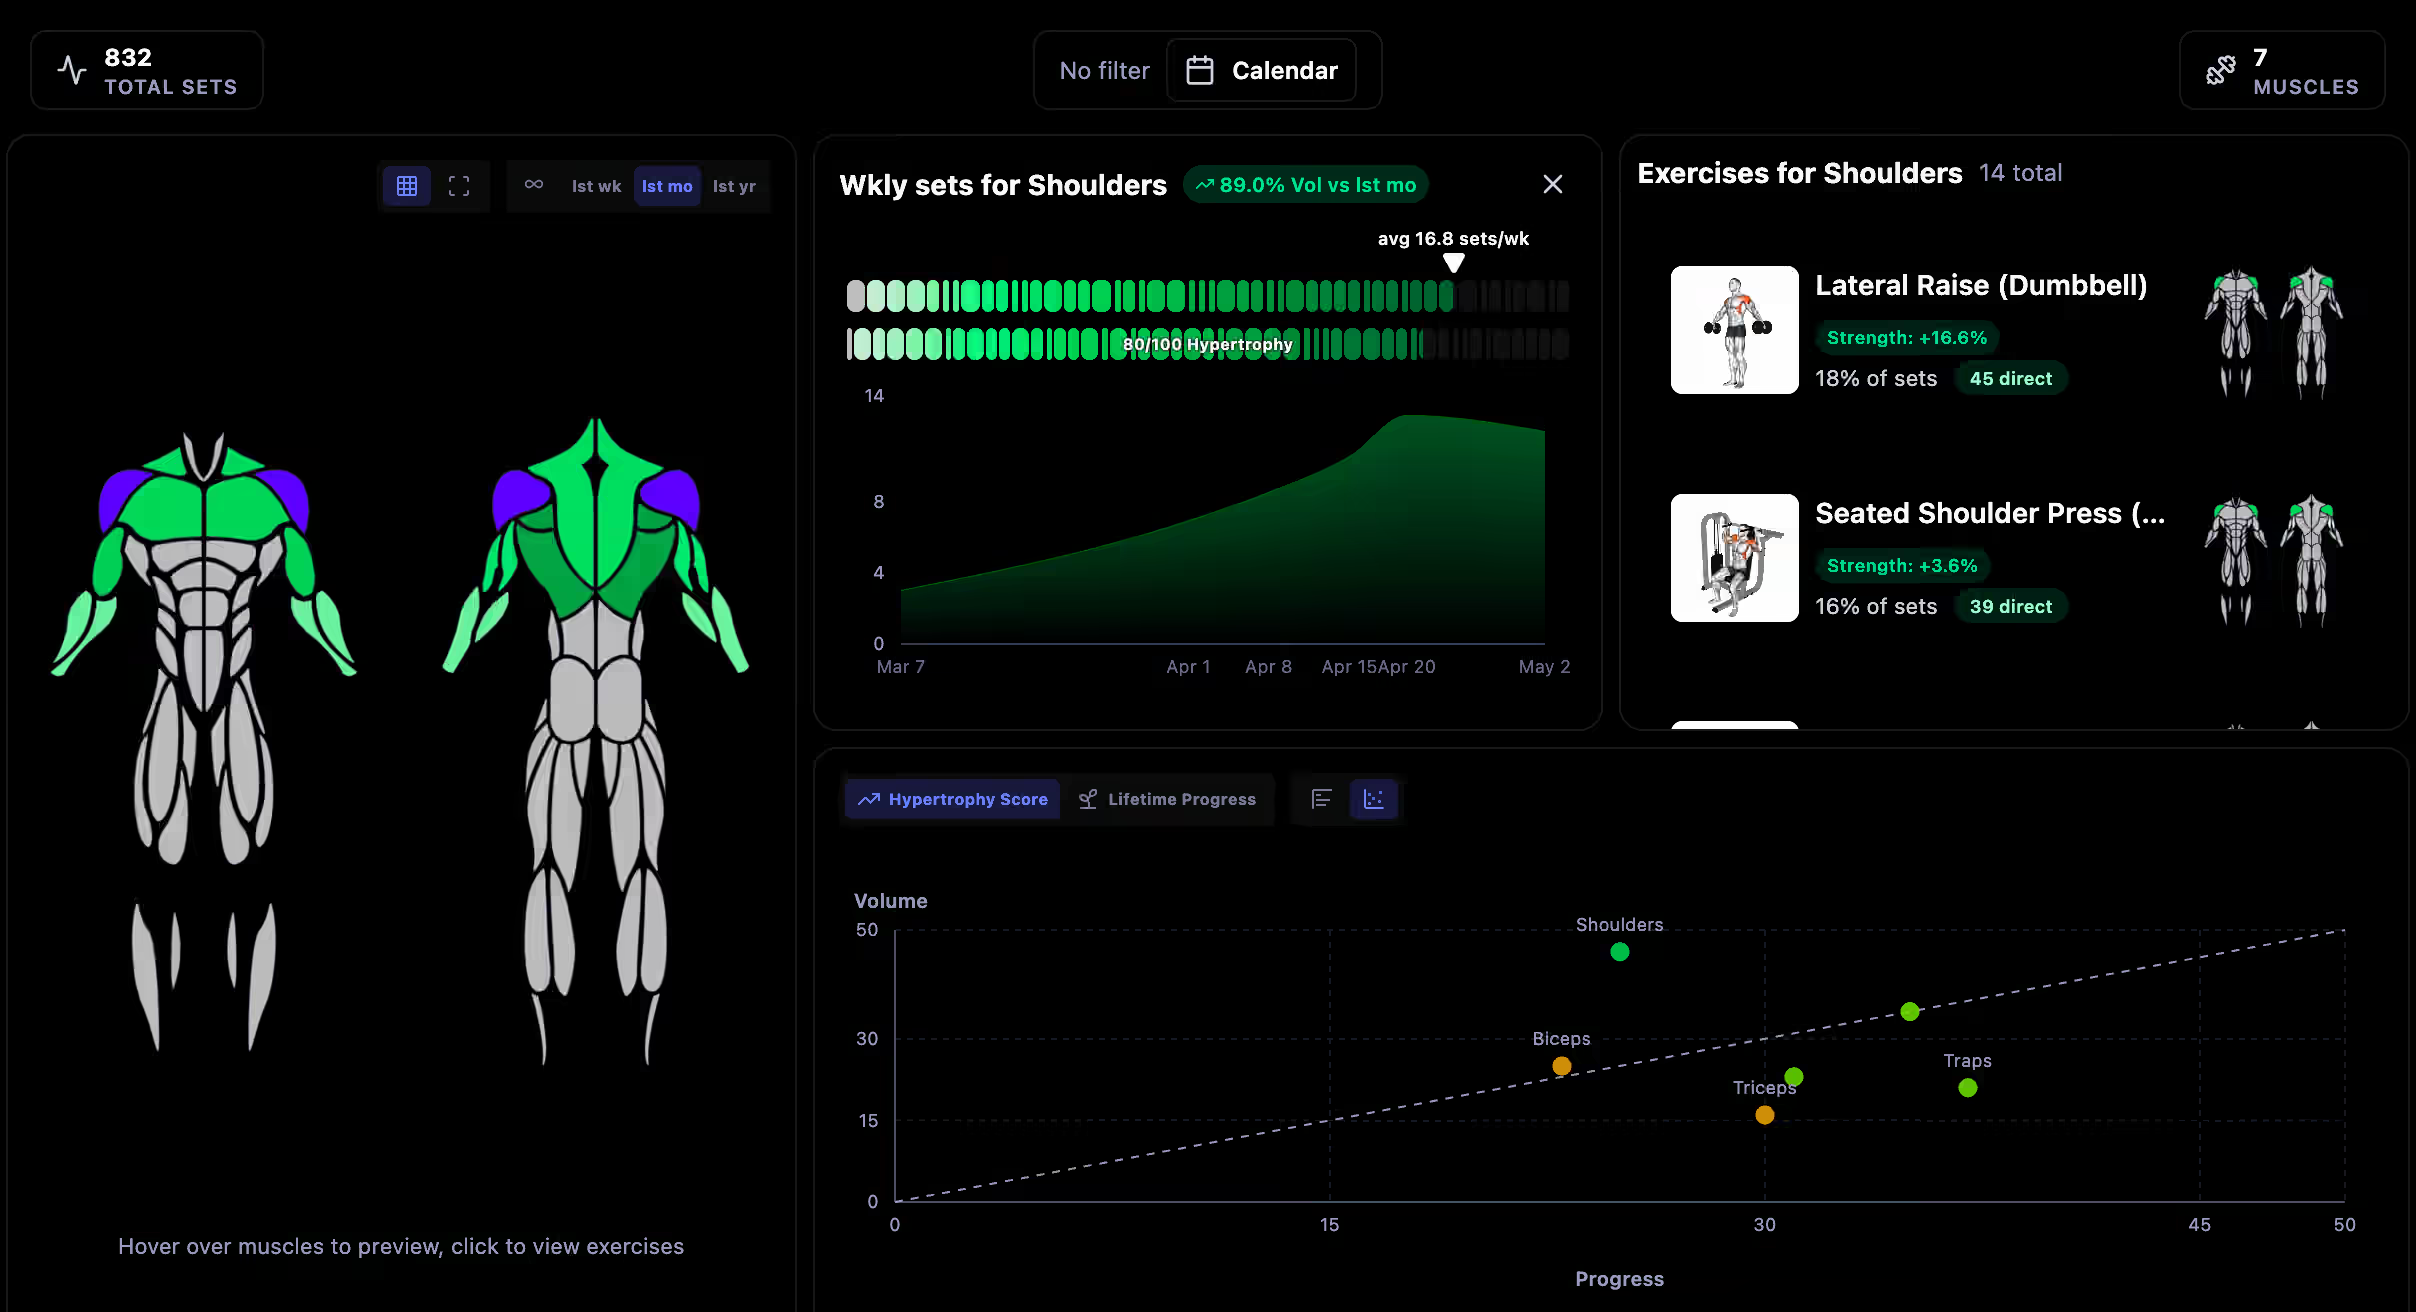
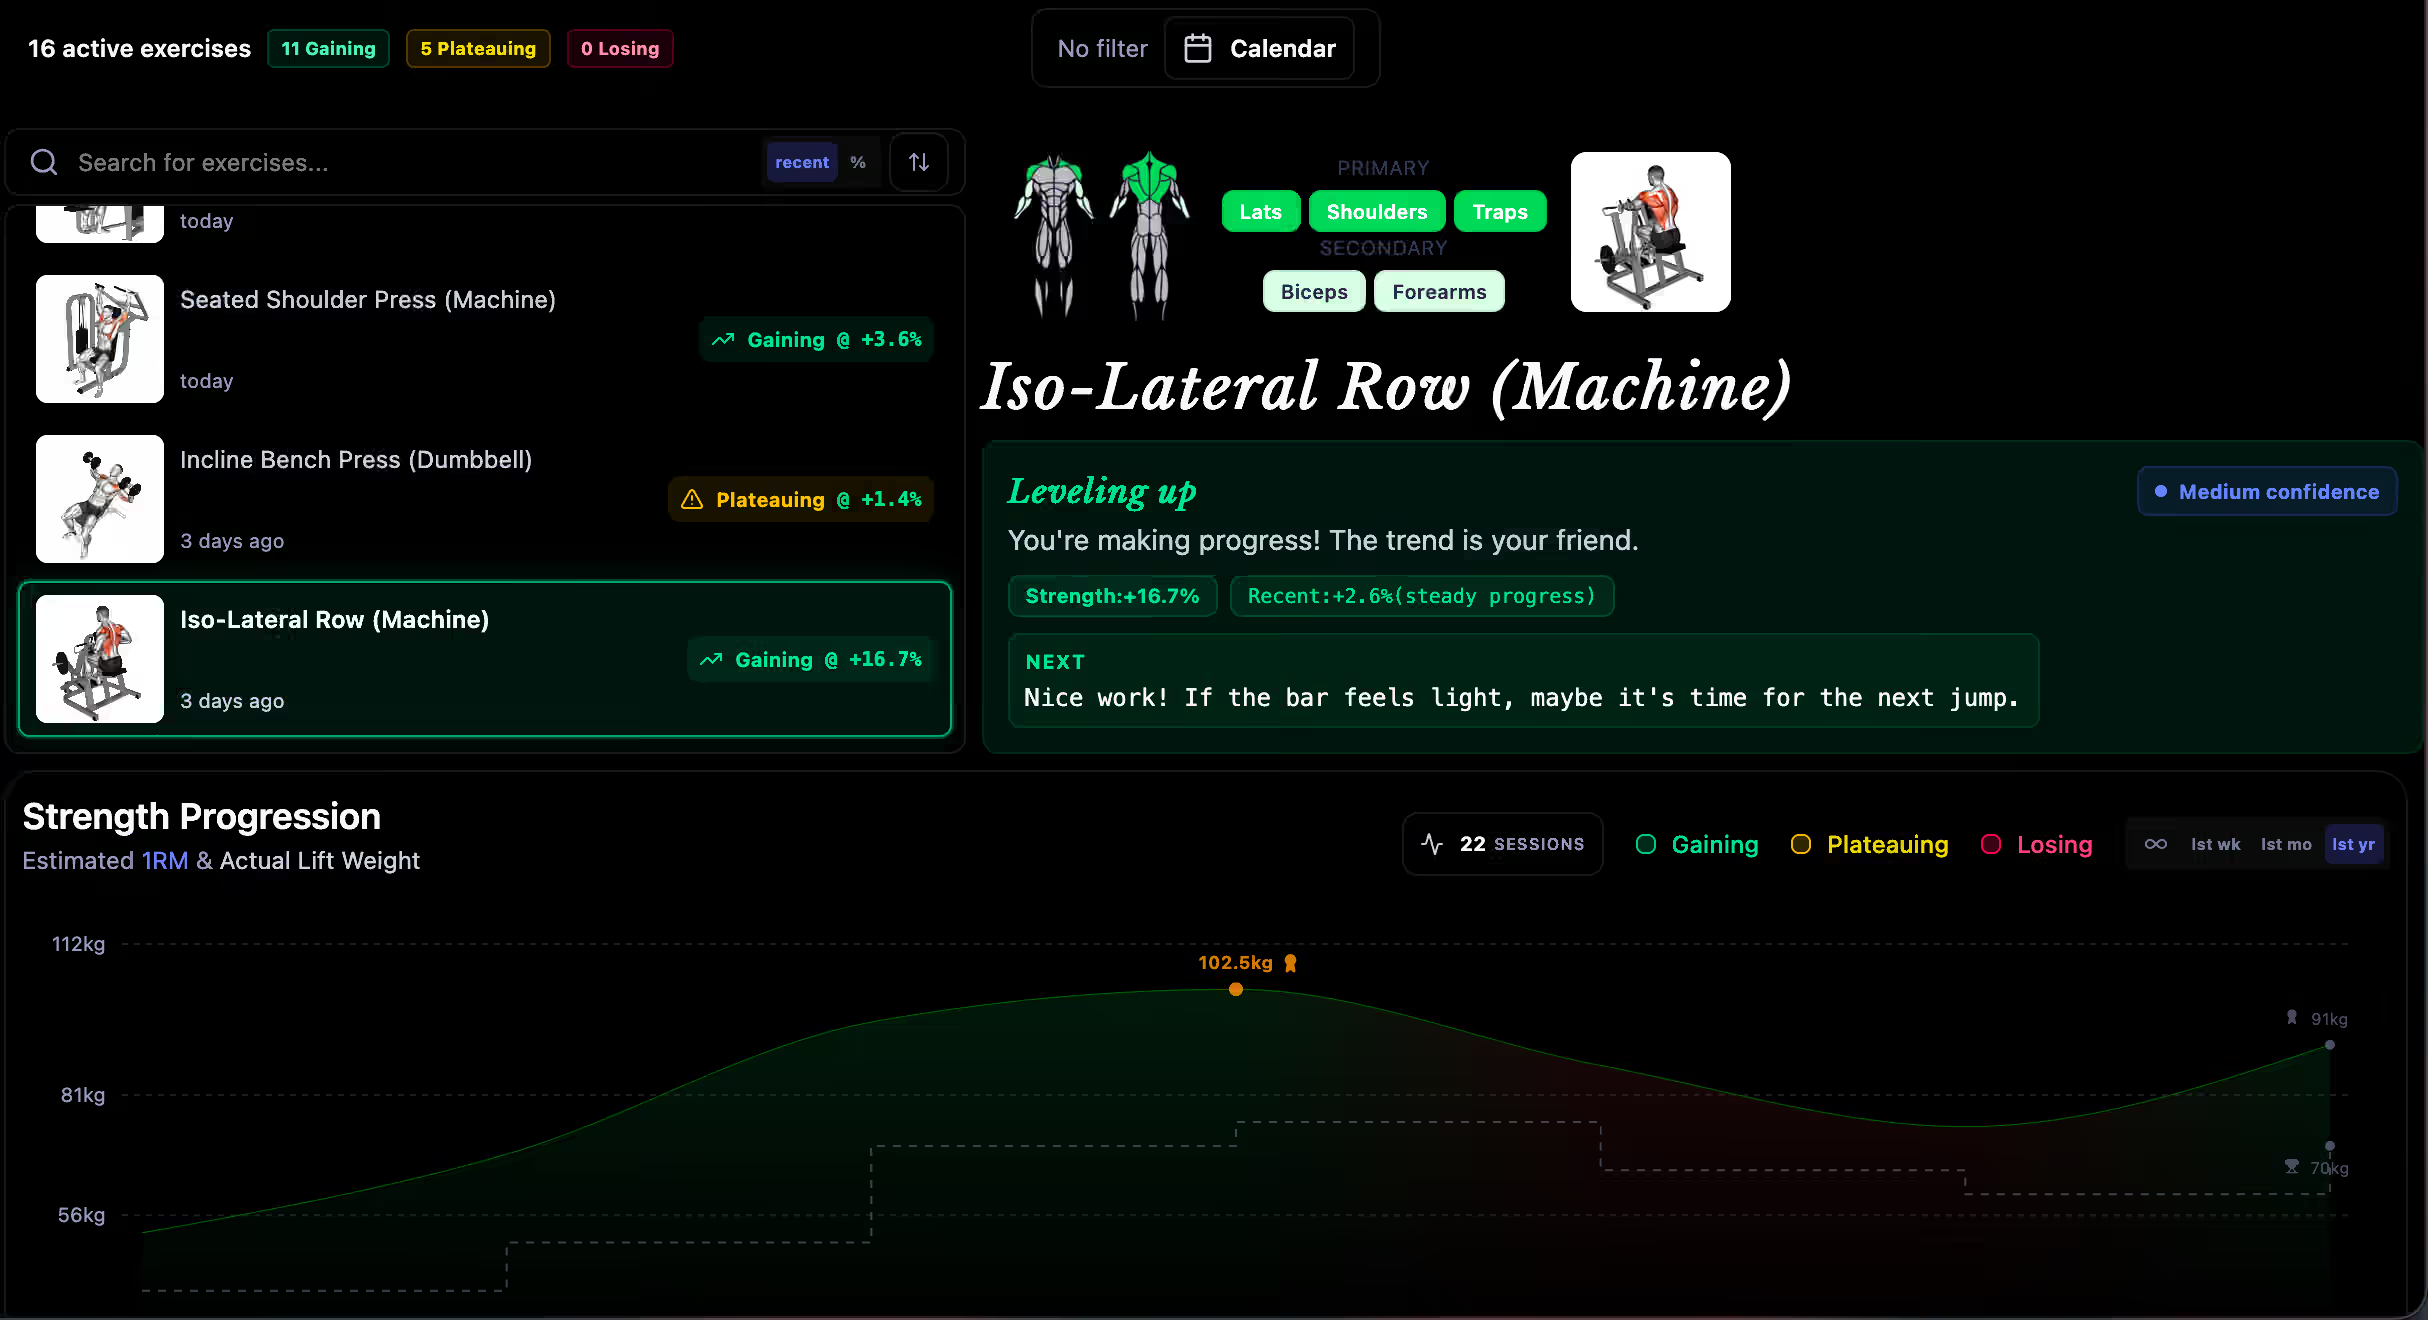
Here are the things that immediately stand out when exploring the dashboard:
- Muscle heatmap. An interactive body model shows the volume load on each muscle group. You can click on a specific muscle and see the exercises that produced that stimulus. The algorithm calculates volume zones (MEV and MRV thresholds) adjusted for training experience and assigns a hypertrophy score from 0 to 100.
- Plateau detection. Instead of a simple weight trend, the tool assigns clear statuses to exercises: growth, plateau, or decline. The system distinguishes between dead-end plateaus (when weight and reps have completely stalled) and wave-like fluctuations, then suggests a solution: add a rep, reduce working weight during a deload week, or change the rep range.
- Breakdown of each set. You can open any past session and view set evaluations. The system identifies normal fatigue, too-abrupt weight jumps, well-executed drop sets, or sets to failure (AMRAP). Each set gets a badge and direct advice for your next workout.
- Merging data from different apps. If you've been using Strong for years and then switched to Hevy, your history usually breaks apart. The project can match different names for the same exercises, remove duplicates, and stitch everything into a single timeline.
- Export for neural networks. If the built-in charts aren't enough, data is exported in a structured format for prompts to ChatGPT or Claude. There are ready-made modules: junk volume audit, side balance check, or joint load assessment.
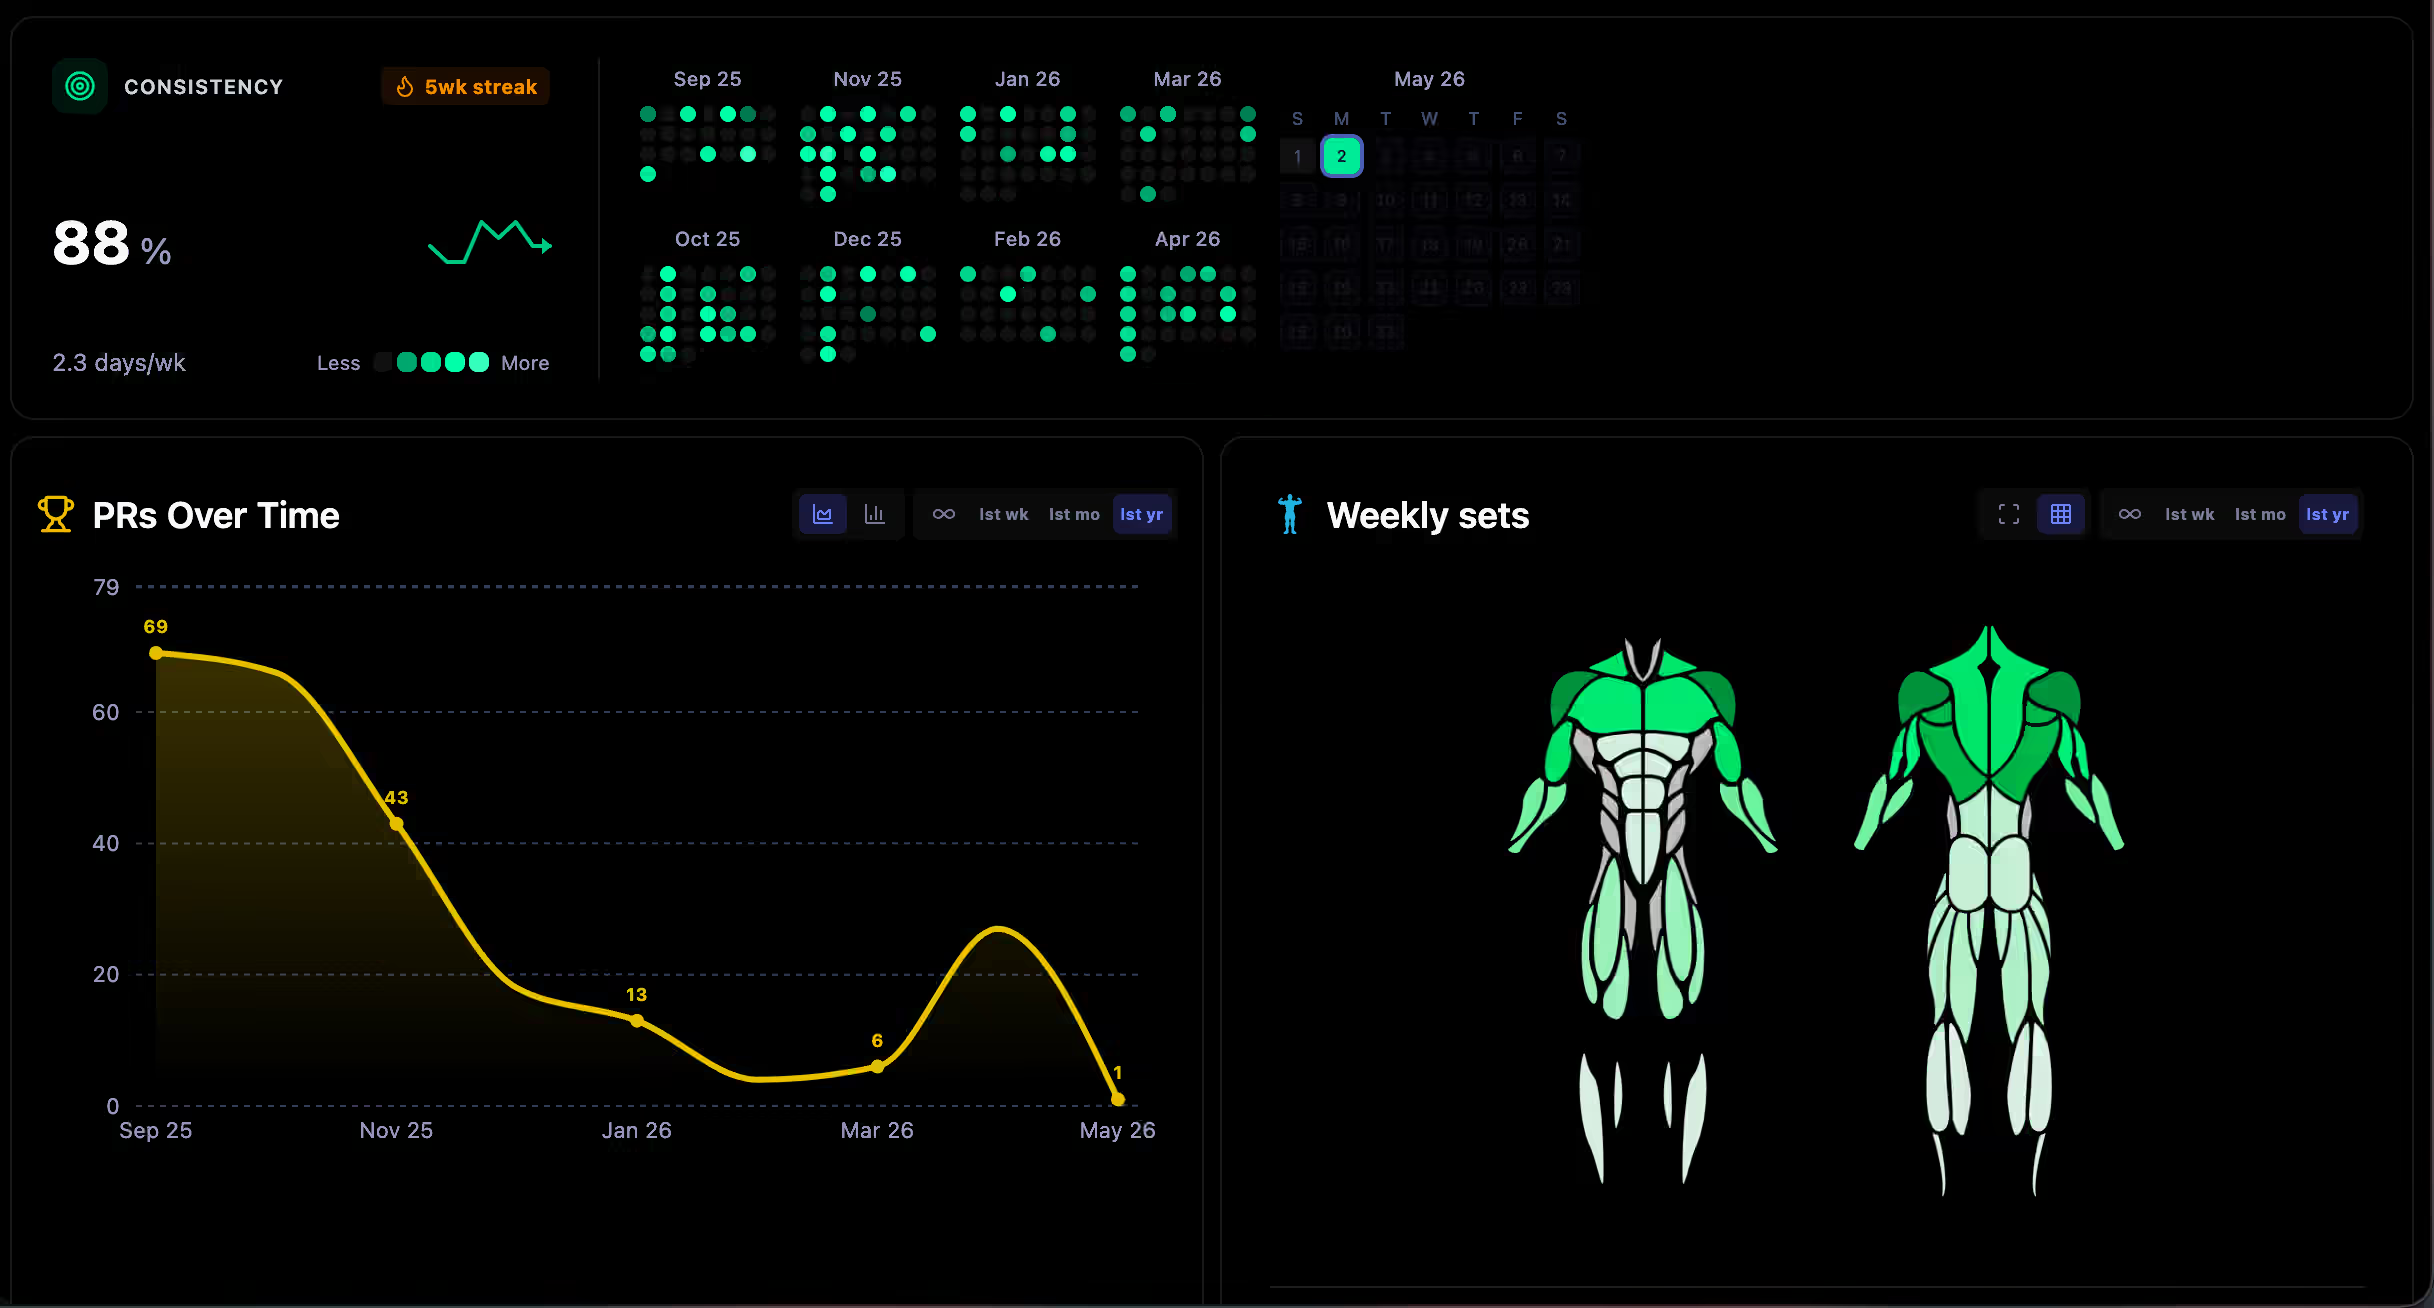
- GitHub-style calendar heatmap. You can clearly see streaks, missed weeks, and consistency for the entire year.
Under the hood
The project architecture is privacy-focused. All computations, CSV parsing, and chart rendering happen on the client side.
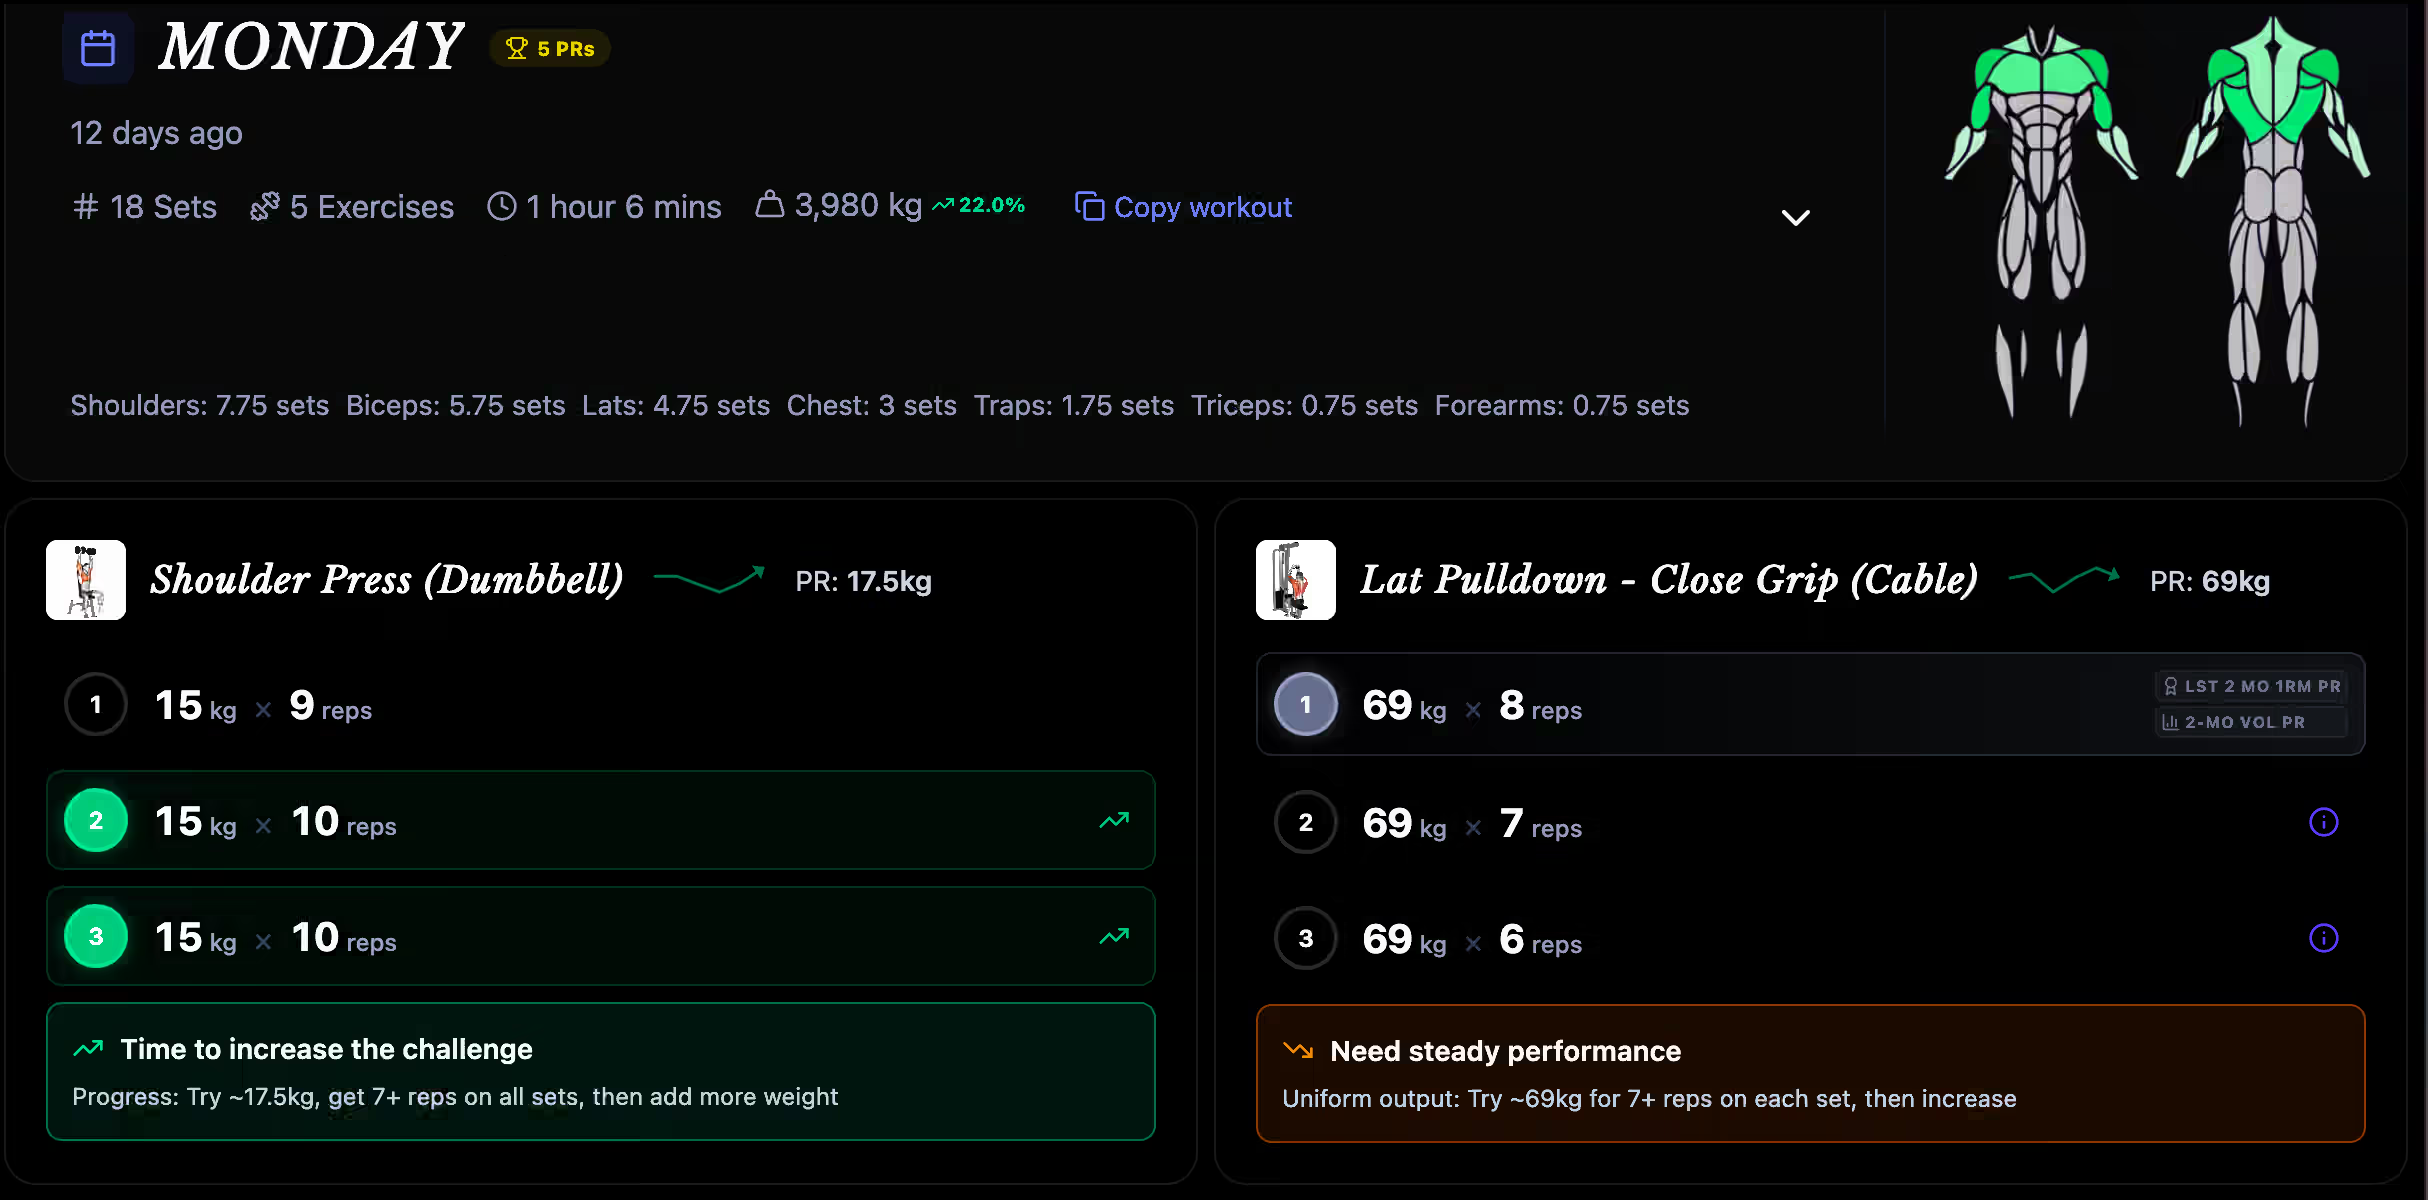
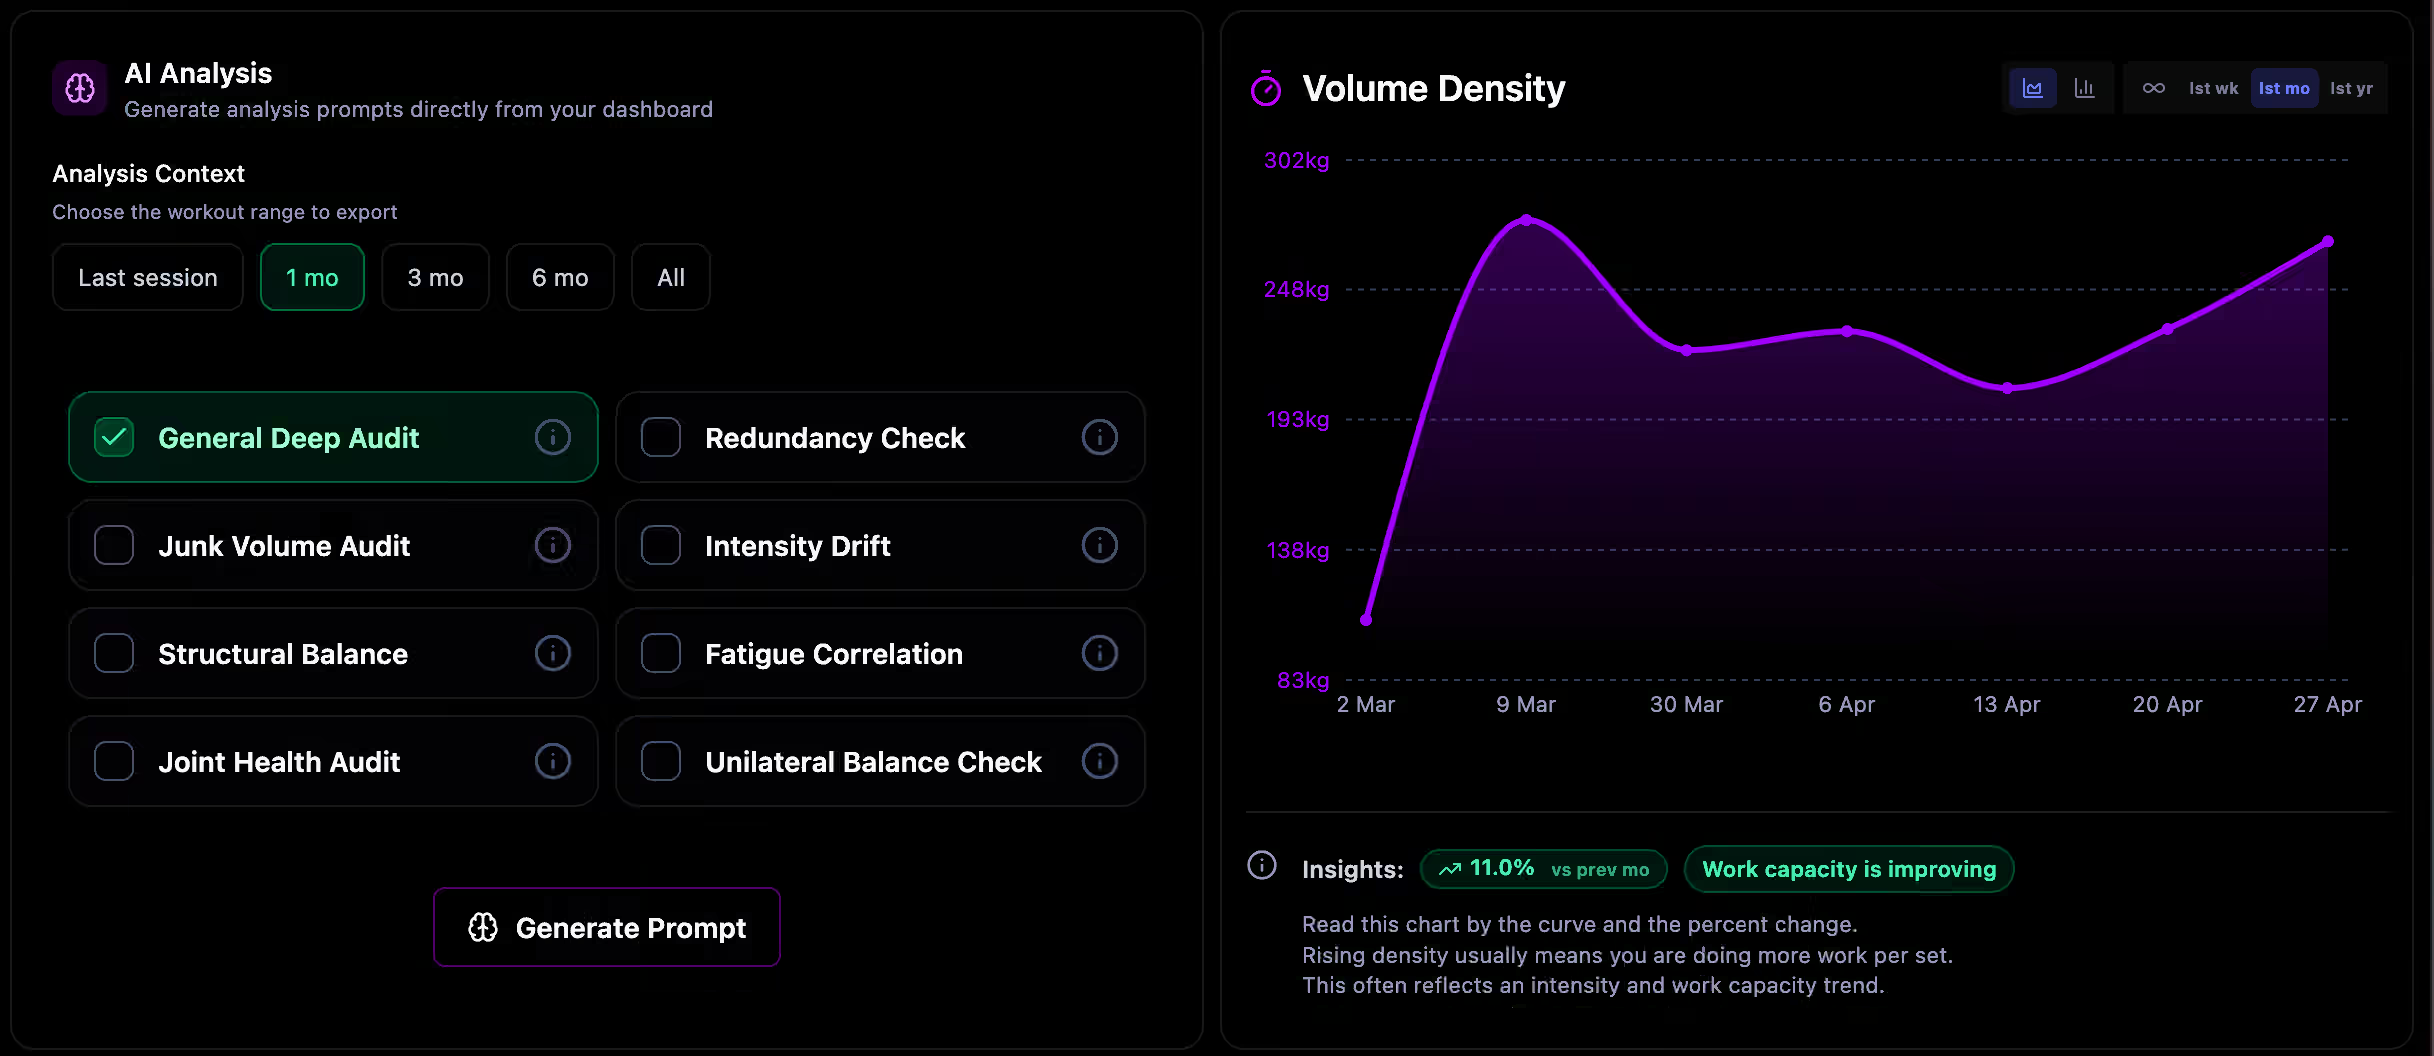
The frontend is built on a modern stack: React 19, TypeScript, Vite, Tailwind CSS, and the Recharts library for data visualization. A small Node.js backend with Express and Puppeteer is used exclusively as a proxy for API calls to trackers like Hevy and Lyfta, where browser CORS restrictions or authorization are required. Training logs don't end up stored on the server.
For working with Strong, CSV file imports are supported with semicolon delimiters, quotes, and weight unit suffixes in headers.
How to run locally
If you want to deploy the project on your machine or write a custom parser, a couple of commands are all you need. You'll need Node.js version 22 or newer.
git clone https://github.com/aree6/LiftShift.git
cd LiftShift
npm install
npm run dev
After startup, the local server will open on Vite's standard port.
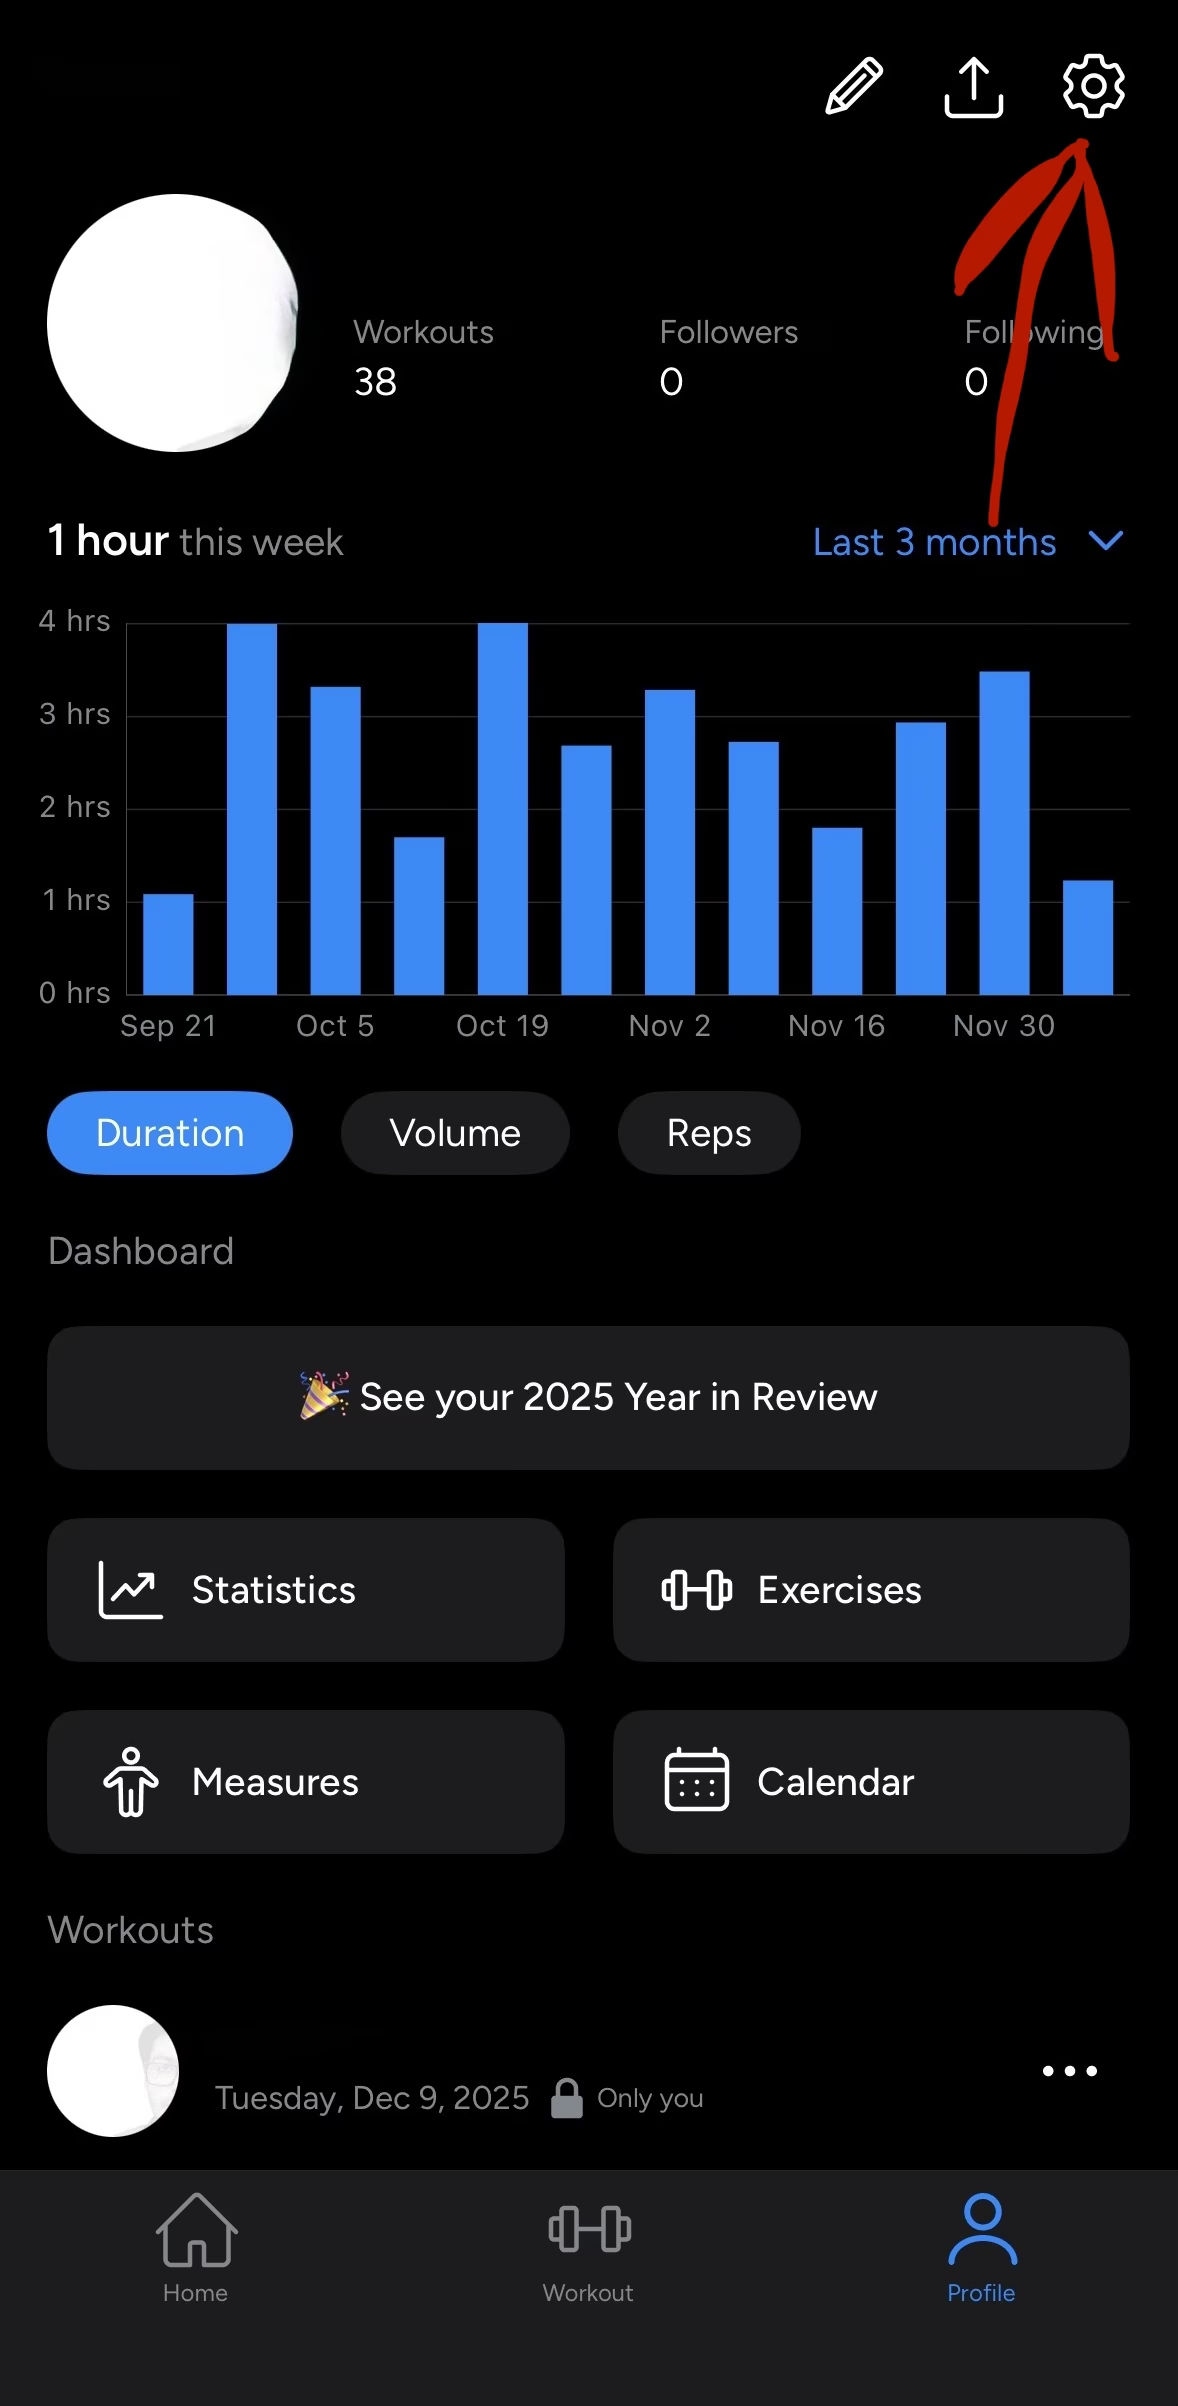
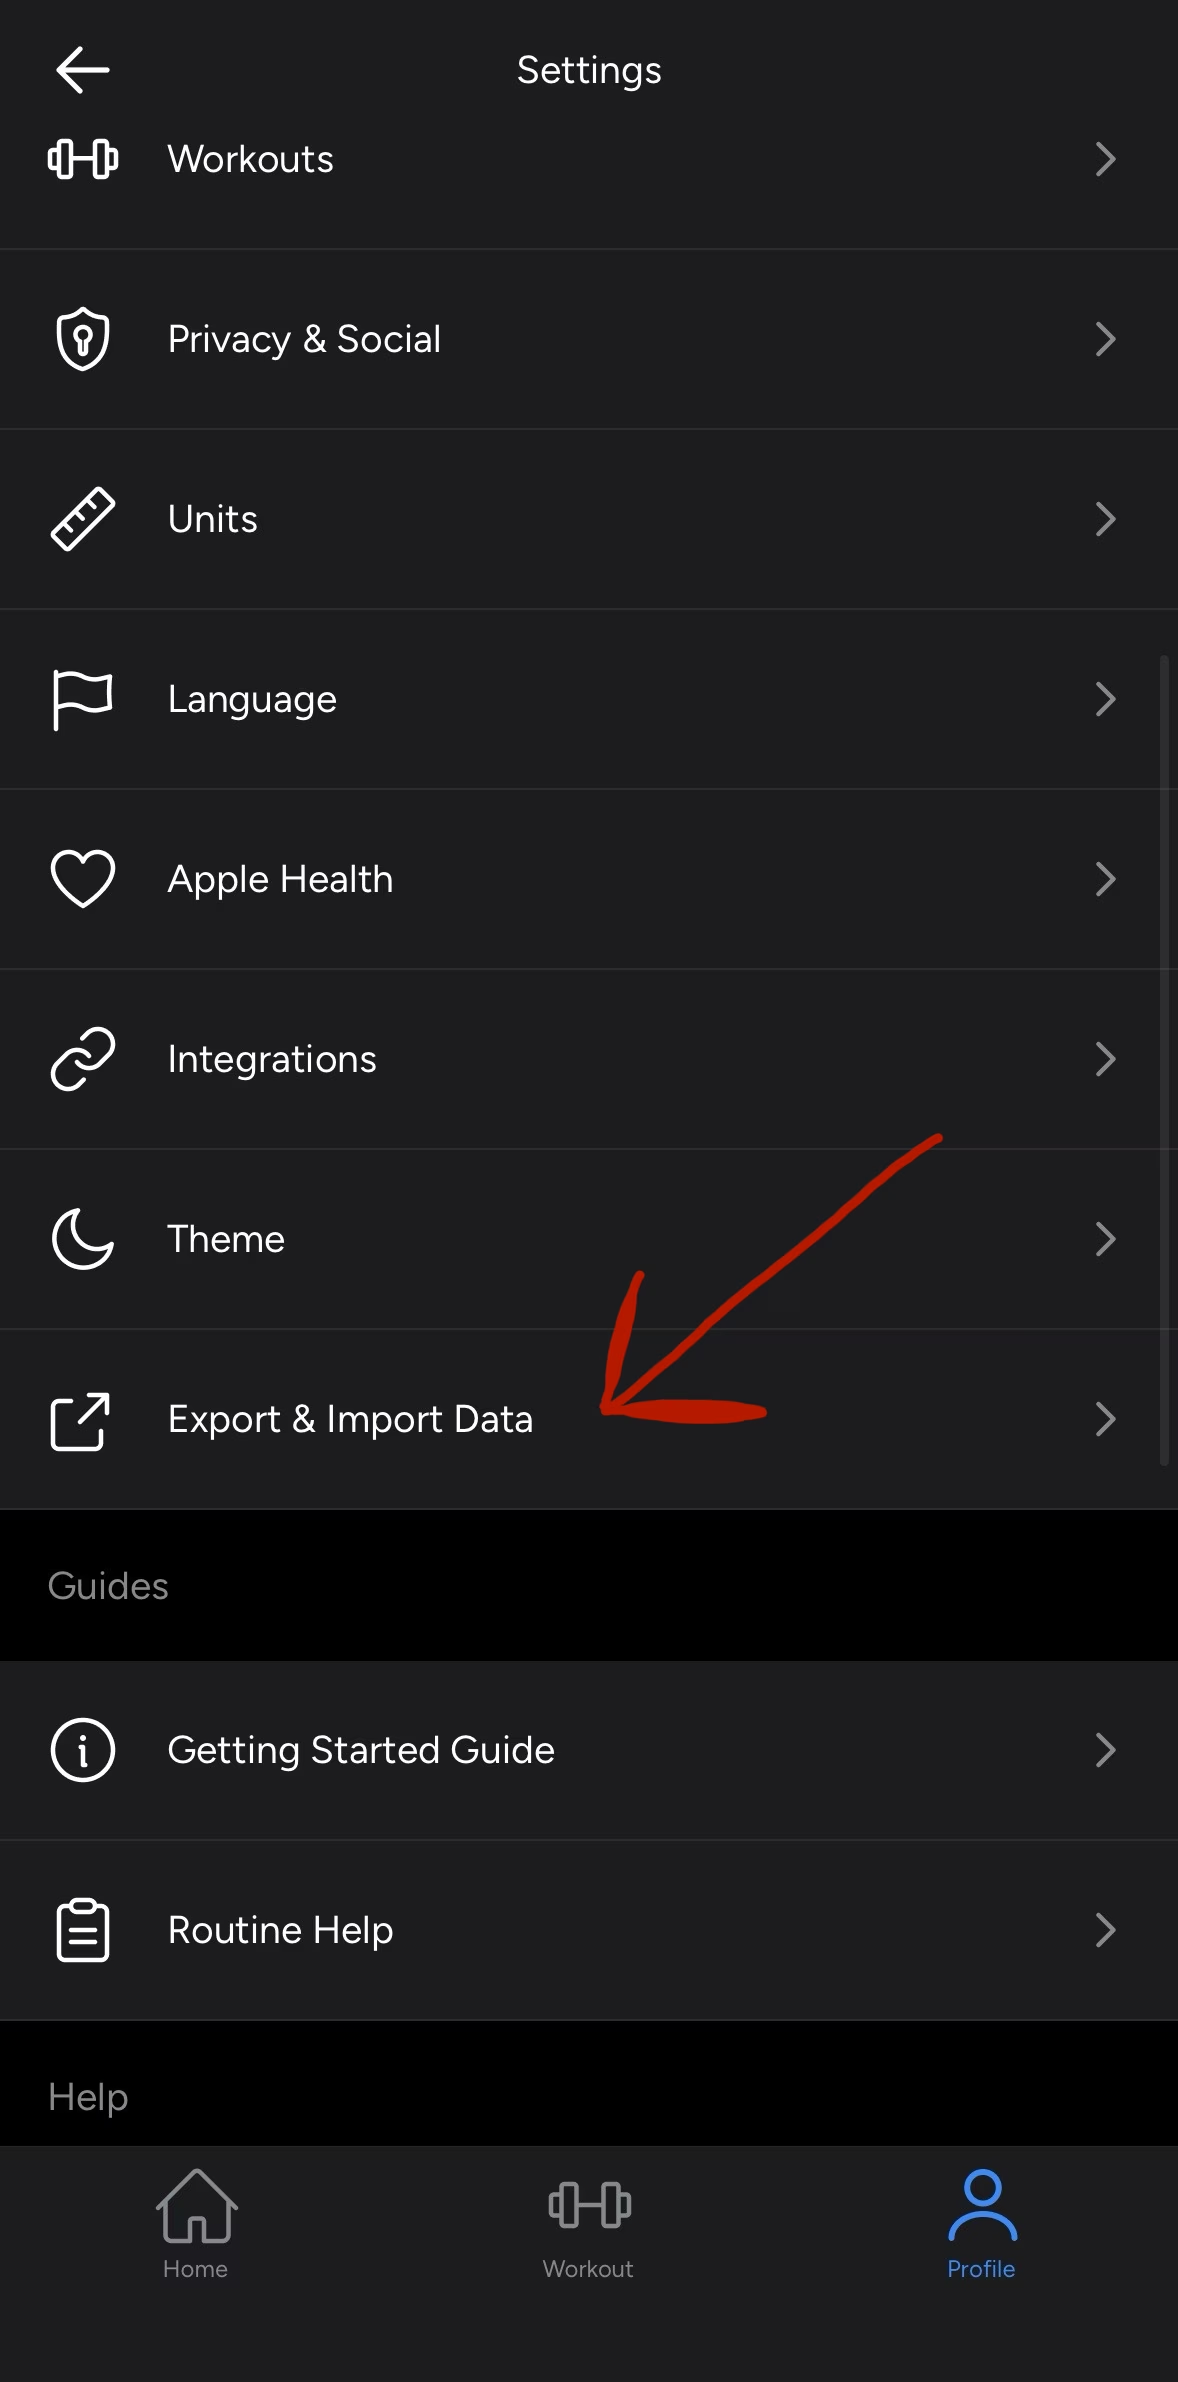
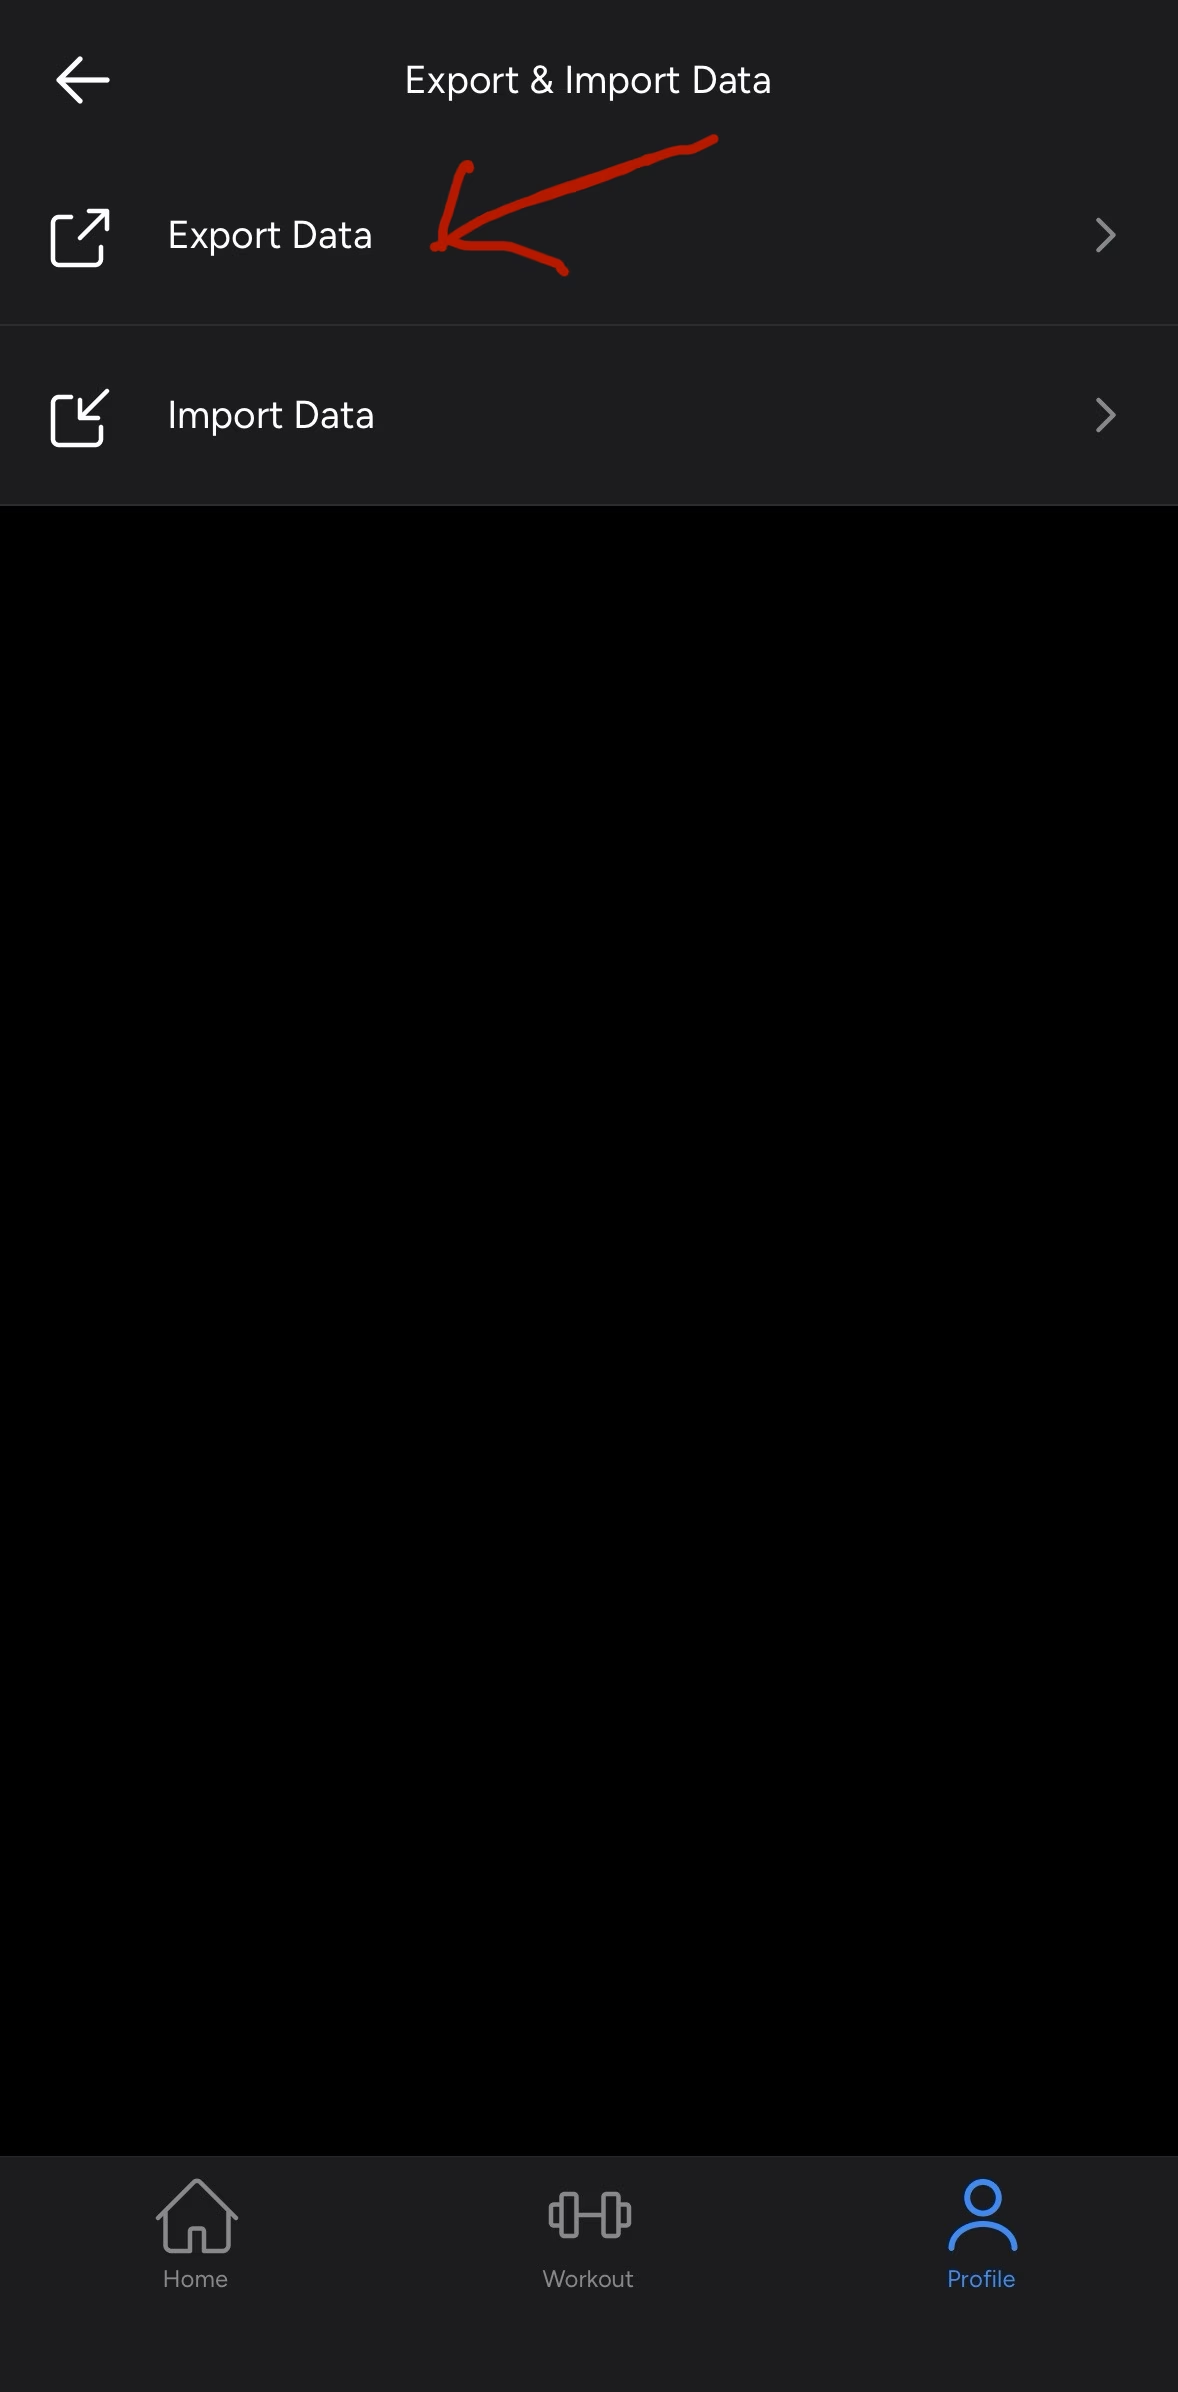
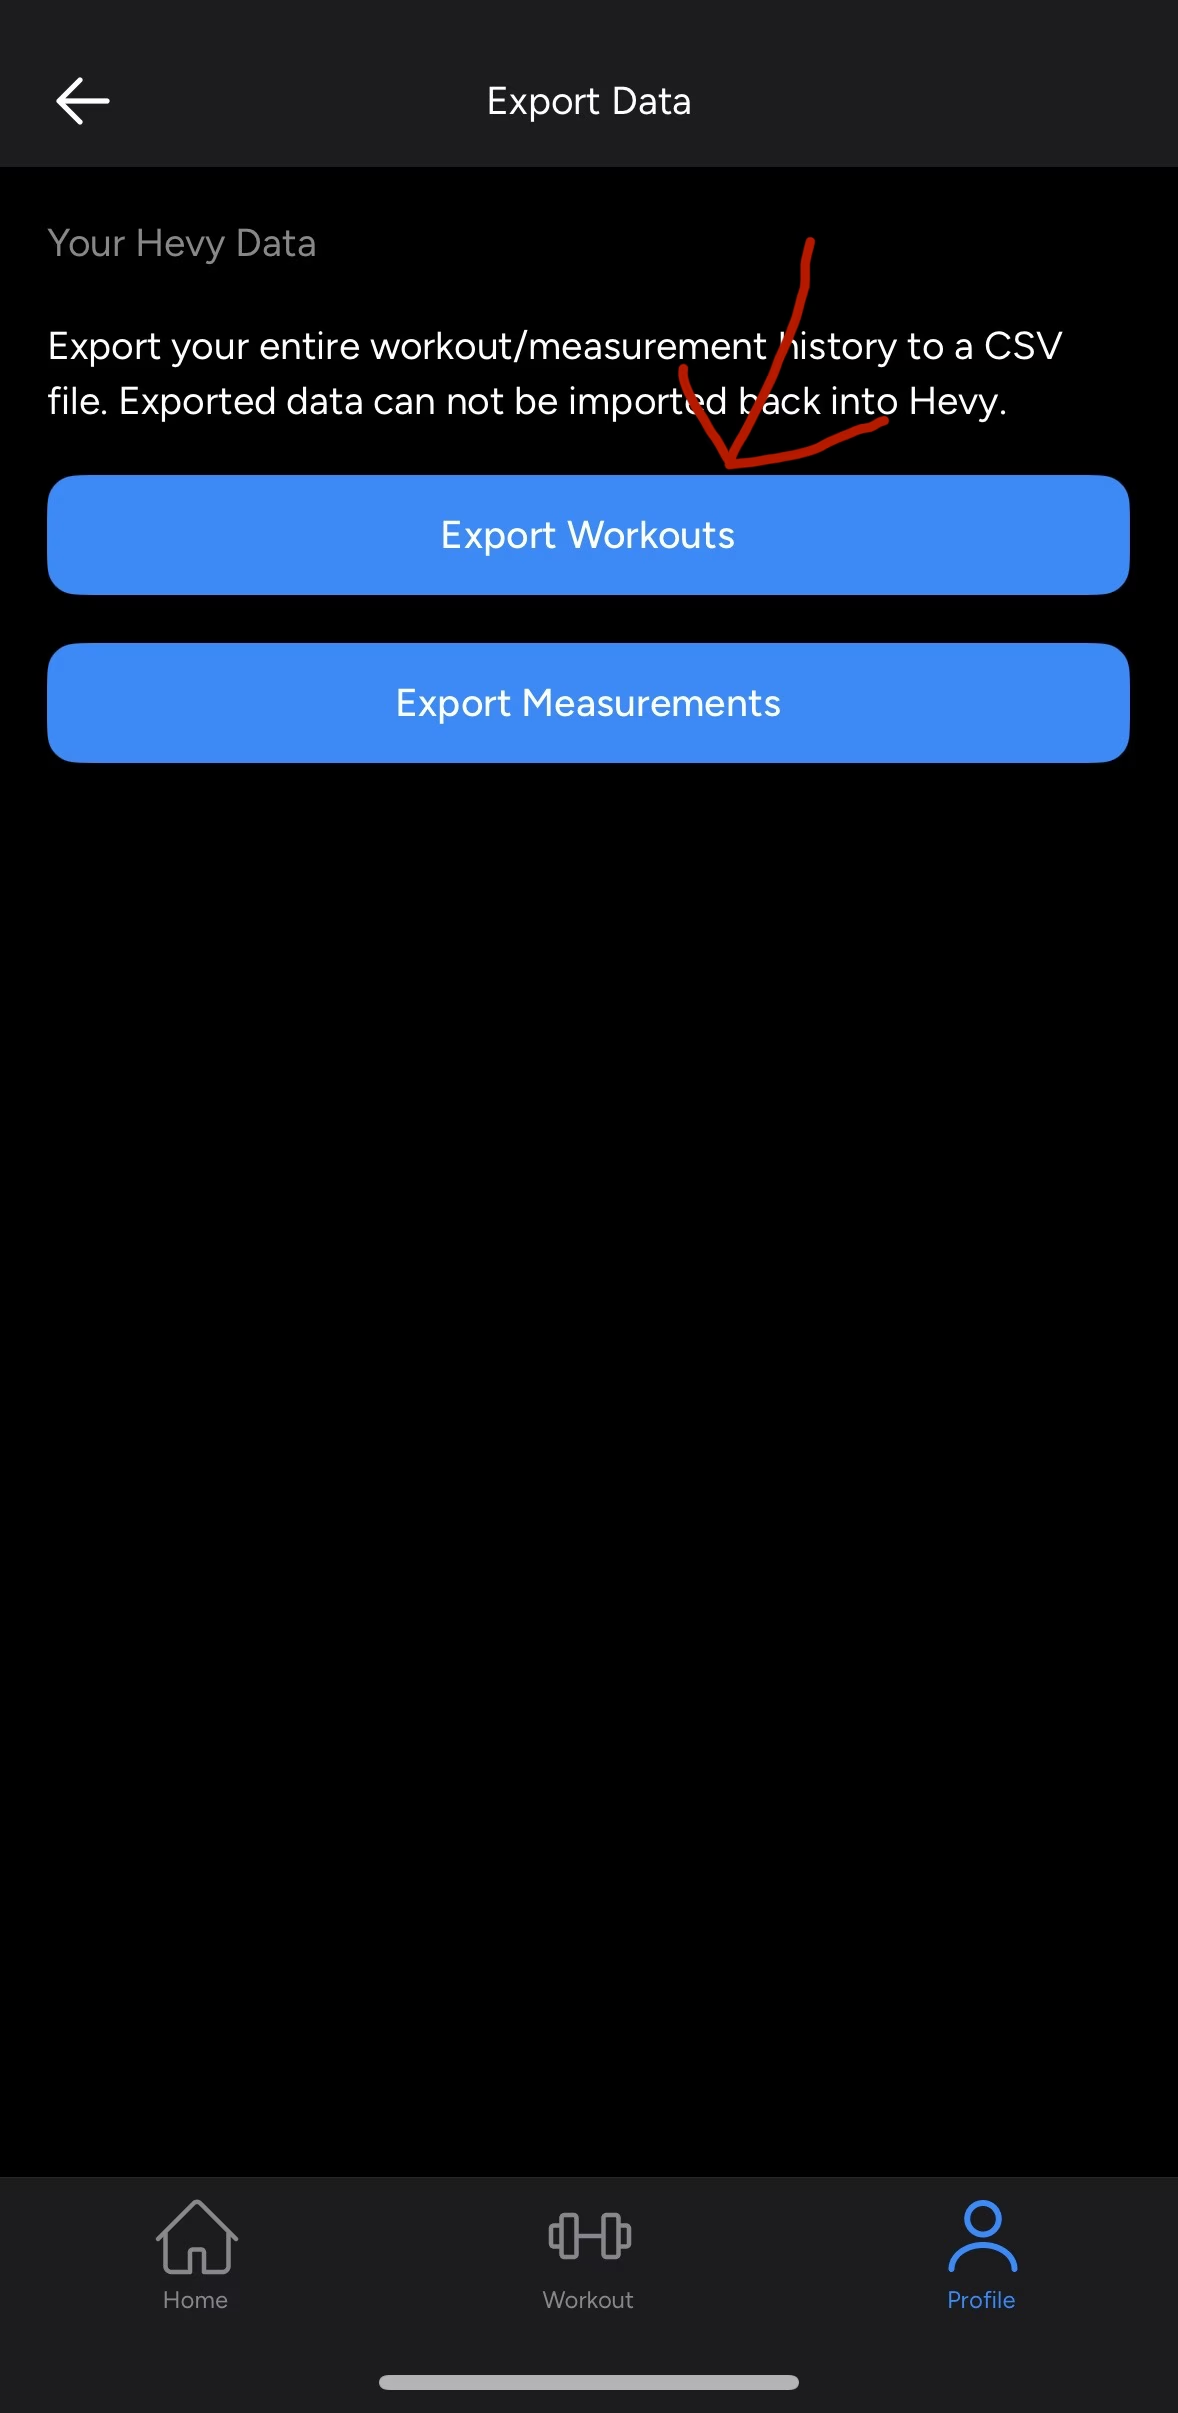
If you're using the public version on the project website, just select your platform, upload a CSV or paste your API key, specify your units (kg or pounds), and head to the dashboard.
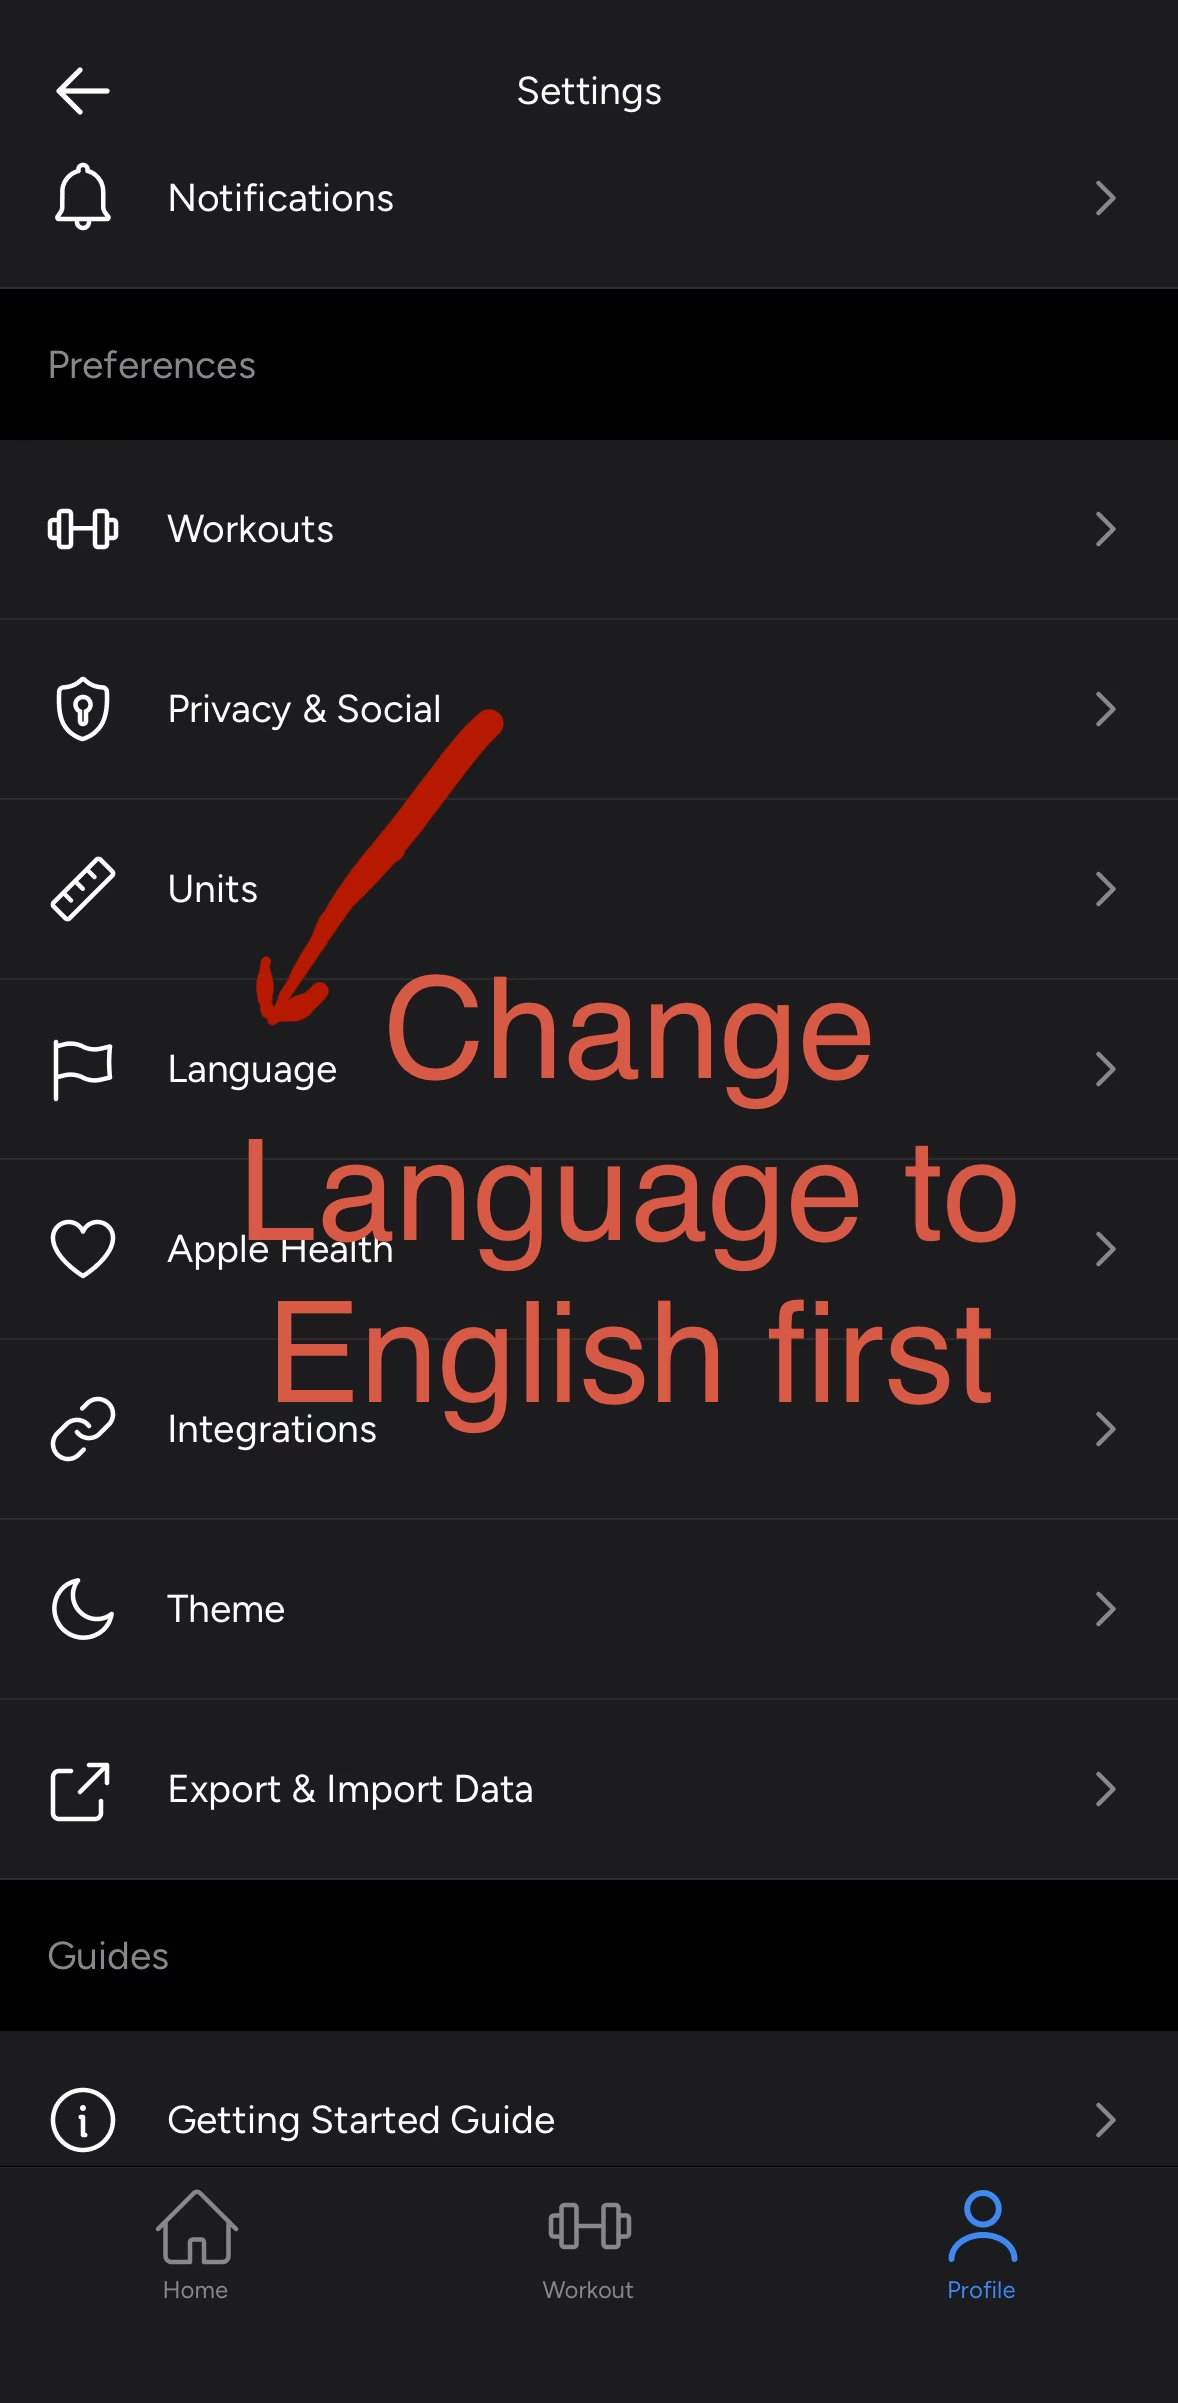
A small detail: when exporting from Hevy, the app sometimes complains about date formats. This happens due to non-English locale in the source app. Simply switch the export language to English temporarily:
Who the project is for
LiftShift perfectly fills the gap between simple gym notebooks and complex trainer spreadsheets in Excel. If you're too lazy to manually calculate tonnage per muscle group and hunt for imbalances, the web client does it in a couple of seconds.
The project is distributed under the AGPL-3.0 license. The codebase is clean, written in strict TypeScript, so if you want to add support for your favorite fitness tracker or implement new periodization metrics, contributing here is quite pleasant.
Related projects