How to Organize Your Neural Network Queries with CPA Manager Plus
When you assemble a stack of several neural network models for production or personal tools, chaos eventually sets in. One request went to Claude, the second to Gemini, the third timed out at OpenAI, and by the end of the month you get a bill for an incomprehensible amount. If you're already using CLIProxyAPI (CPA) for traffic routing, the standard interface quickly becomes insufficient.
The CPA Manager Plus (CPAMP) project fills this gap. It's a control panel and observability system that deploys on your own server, stores request history locally, and helps you understand where tokens are actually being consumed.
Under the Hood
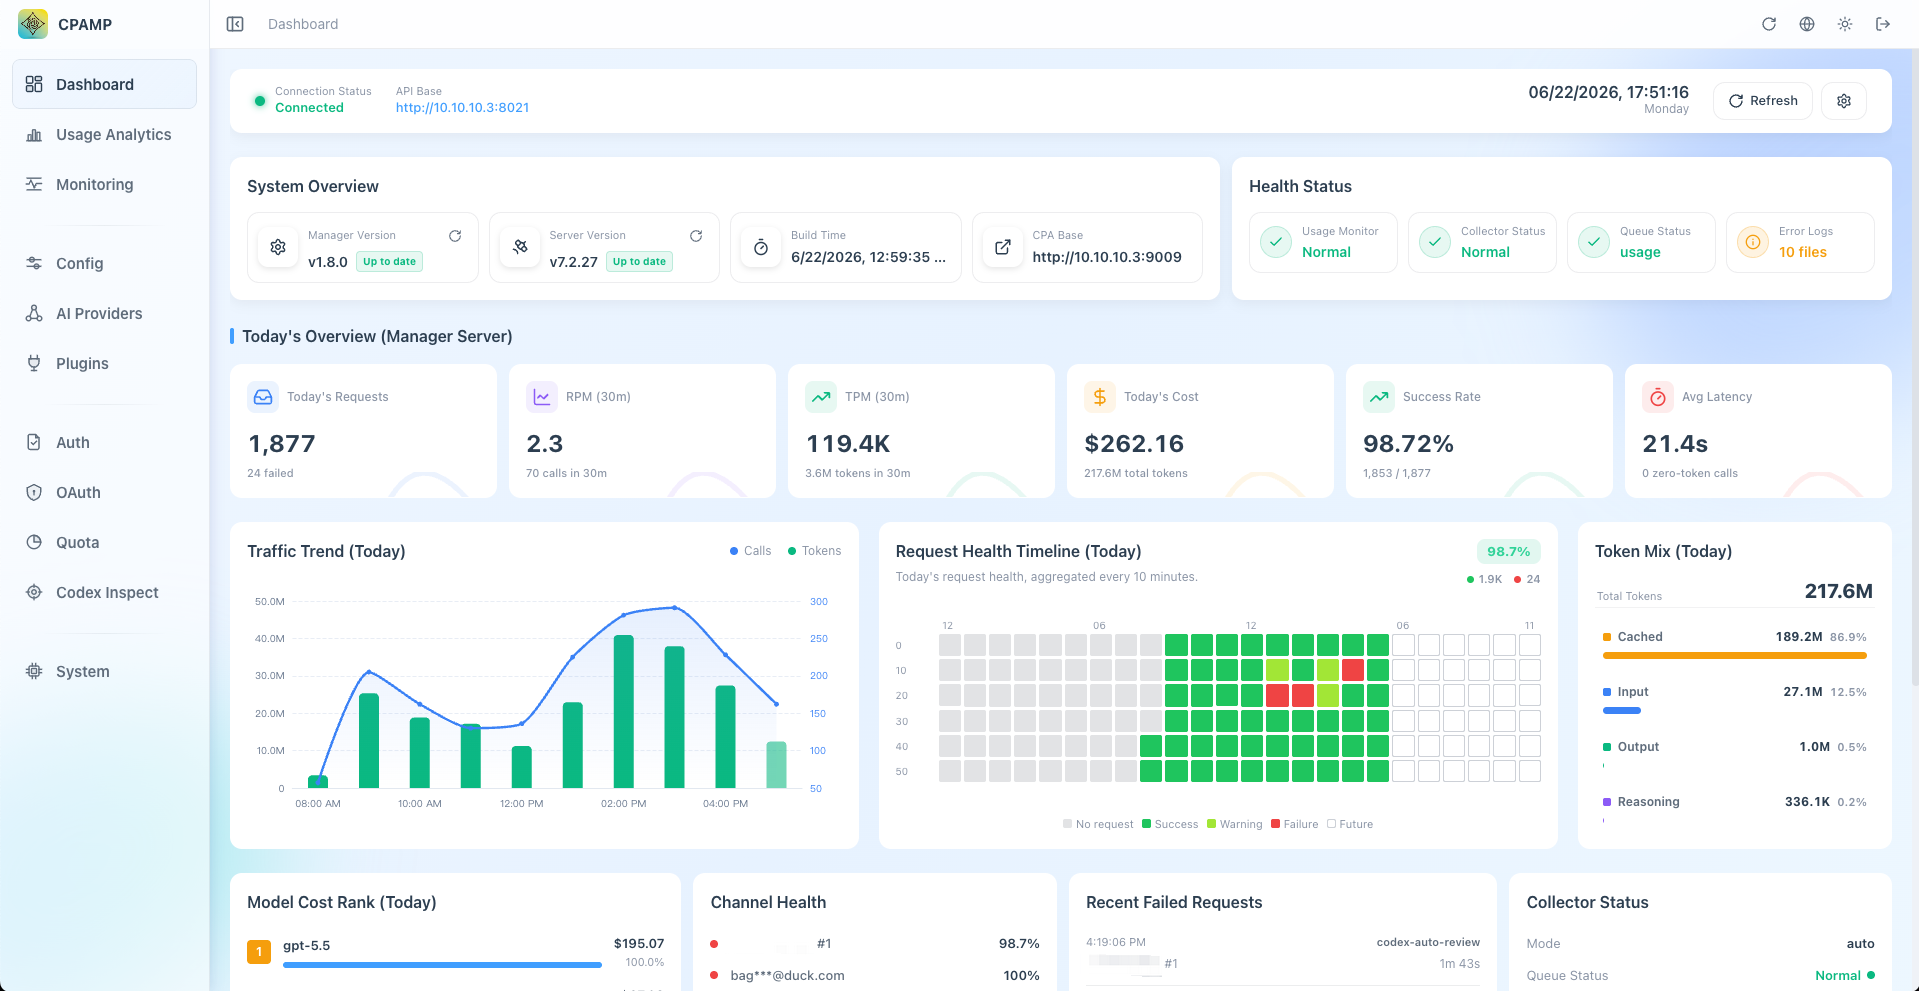
The tool consists of two parts. The first part is a web interface that can be embedded directly into CPA instead of the default panel. The second is a separate Manager Server in Go with a SQLite database.
The architecture is straightforward and doesn't require cloud registrations. The project doesn't send any telemetry externally—all logs and model pricing data are stored in local files. Access keys are encrypted before being written to the database using a local key data.key.
Main Panel Features
Finding Failures Without Data Leakage
The main issue with API aggregators is that it's hard to understand why a request failed. Logs typically contain either a mess or raw JSON with sensitive user data.
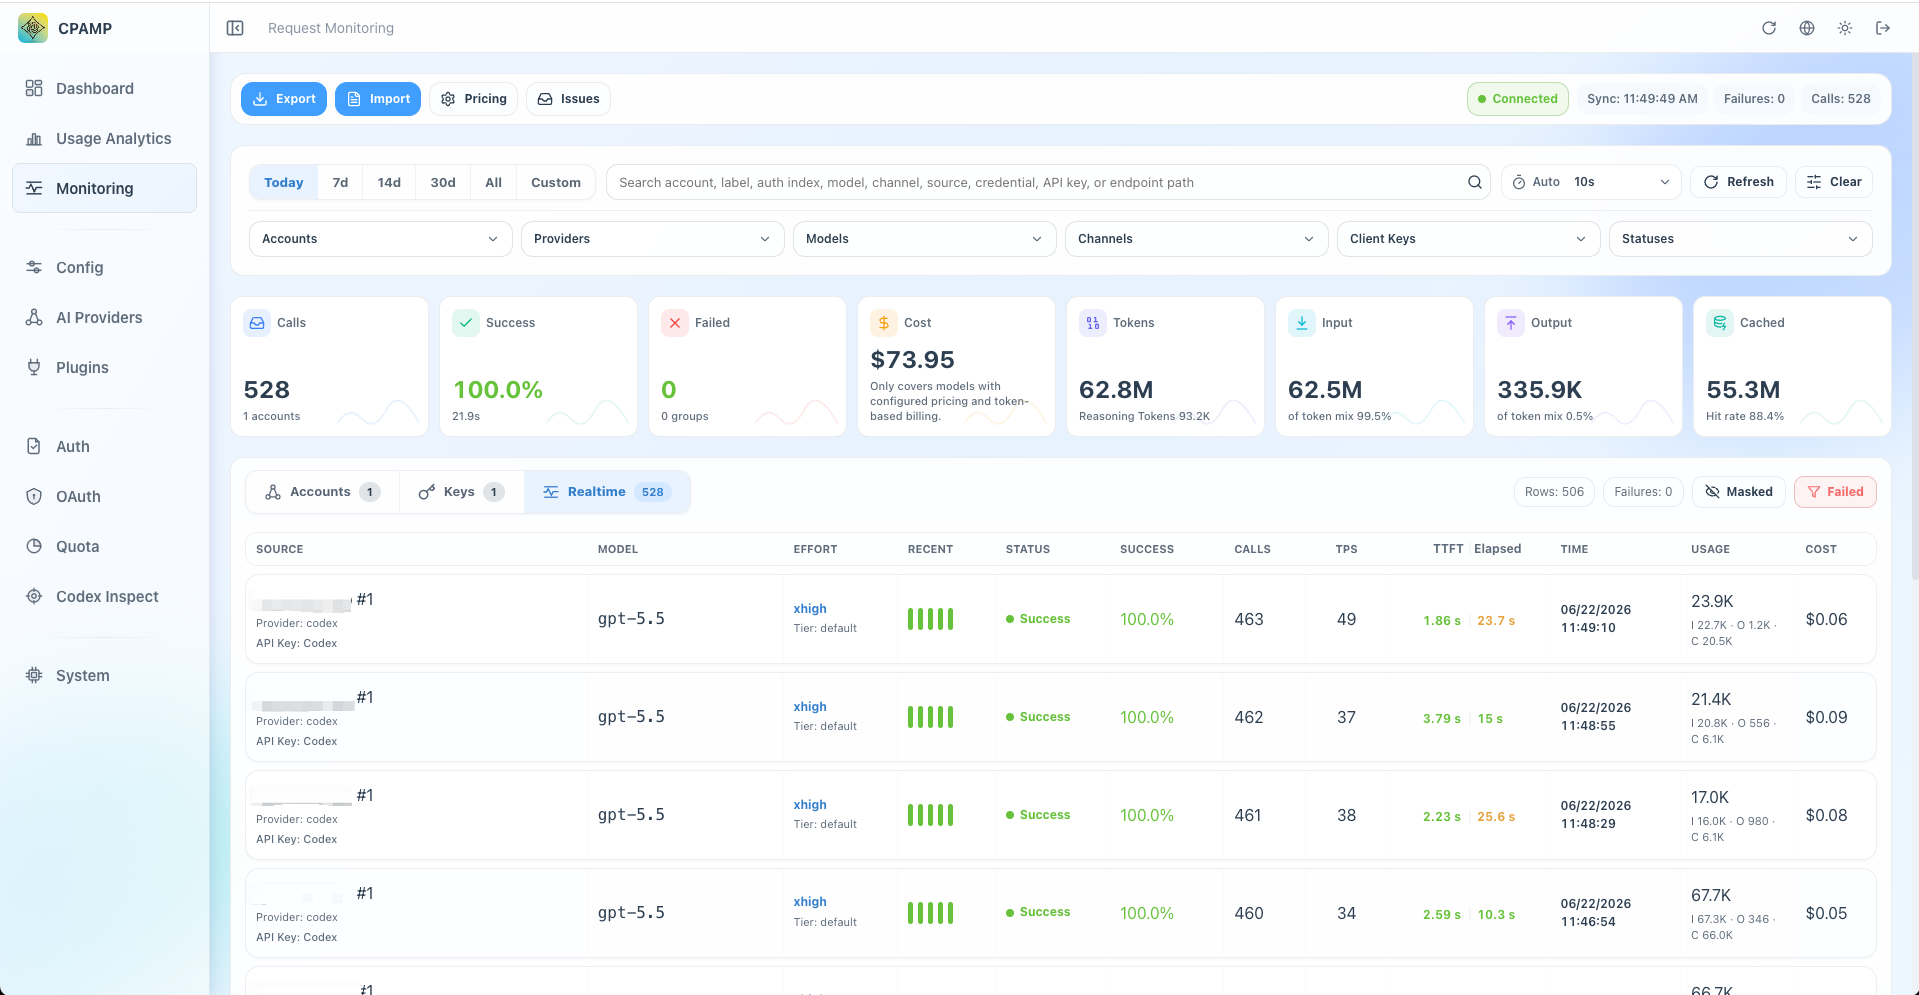
CPAMP pulls data from the CPA queue and stores it in SQLite. You get search by status, latency, token types, and accounts. Error bodies are automatically stripped of private information. If you need to transfer logs for debugging to another system, history can be exported in JSONL format.
Accurate Cost Tracking
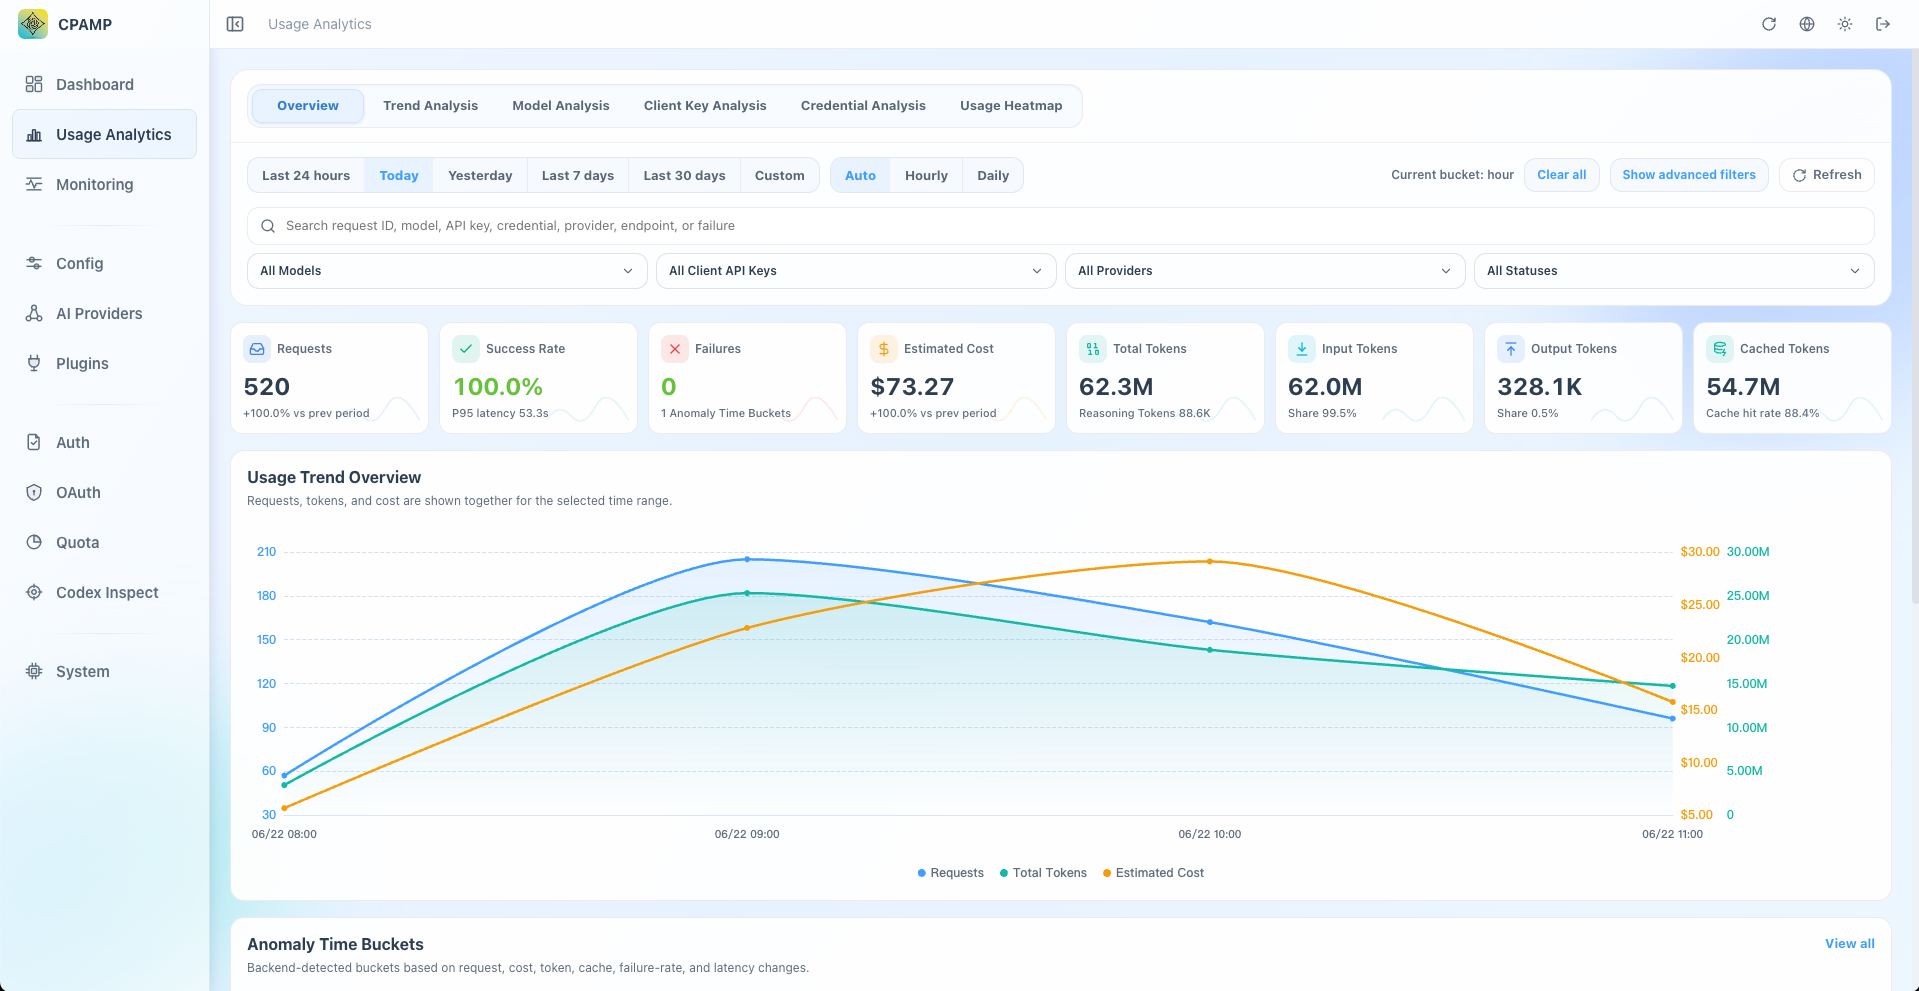
The panel breaks down costs by model, provider, account, client API keys, and projects.
Prices are pulled automatically from models.dev, and in case of issues there are fallbacks to LiteLLM and OpenRouter. If you have custom endpoints or corporate discounts, prices can be overridden manually. The application accounts for complex pricing structures: the difference between input and output tokens, context caching, and reasoning tokens.
Account Control and Quota Automation
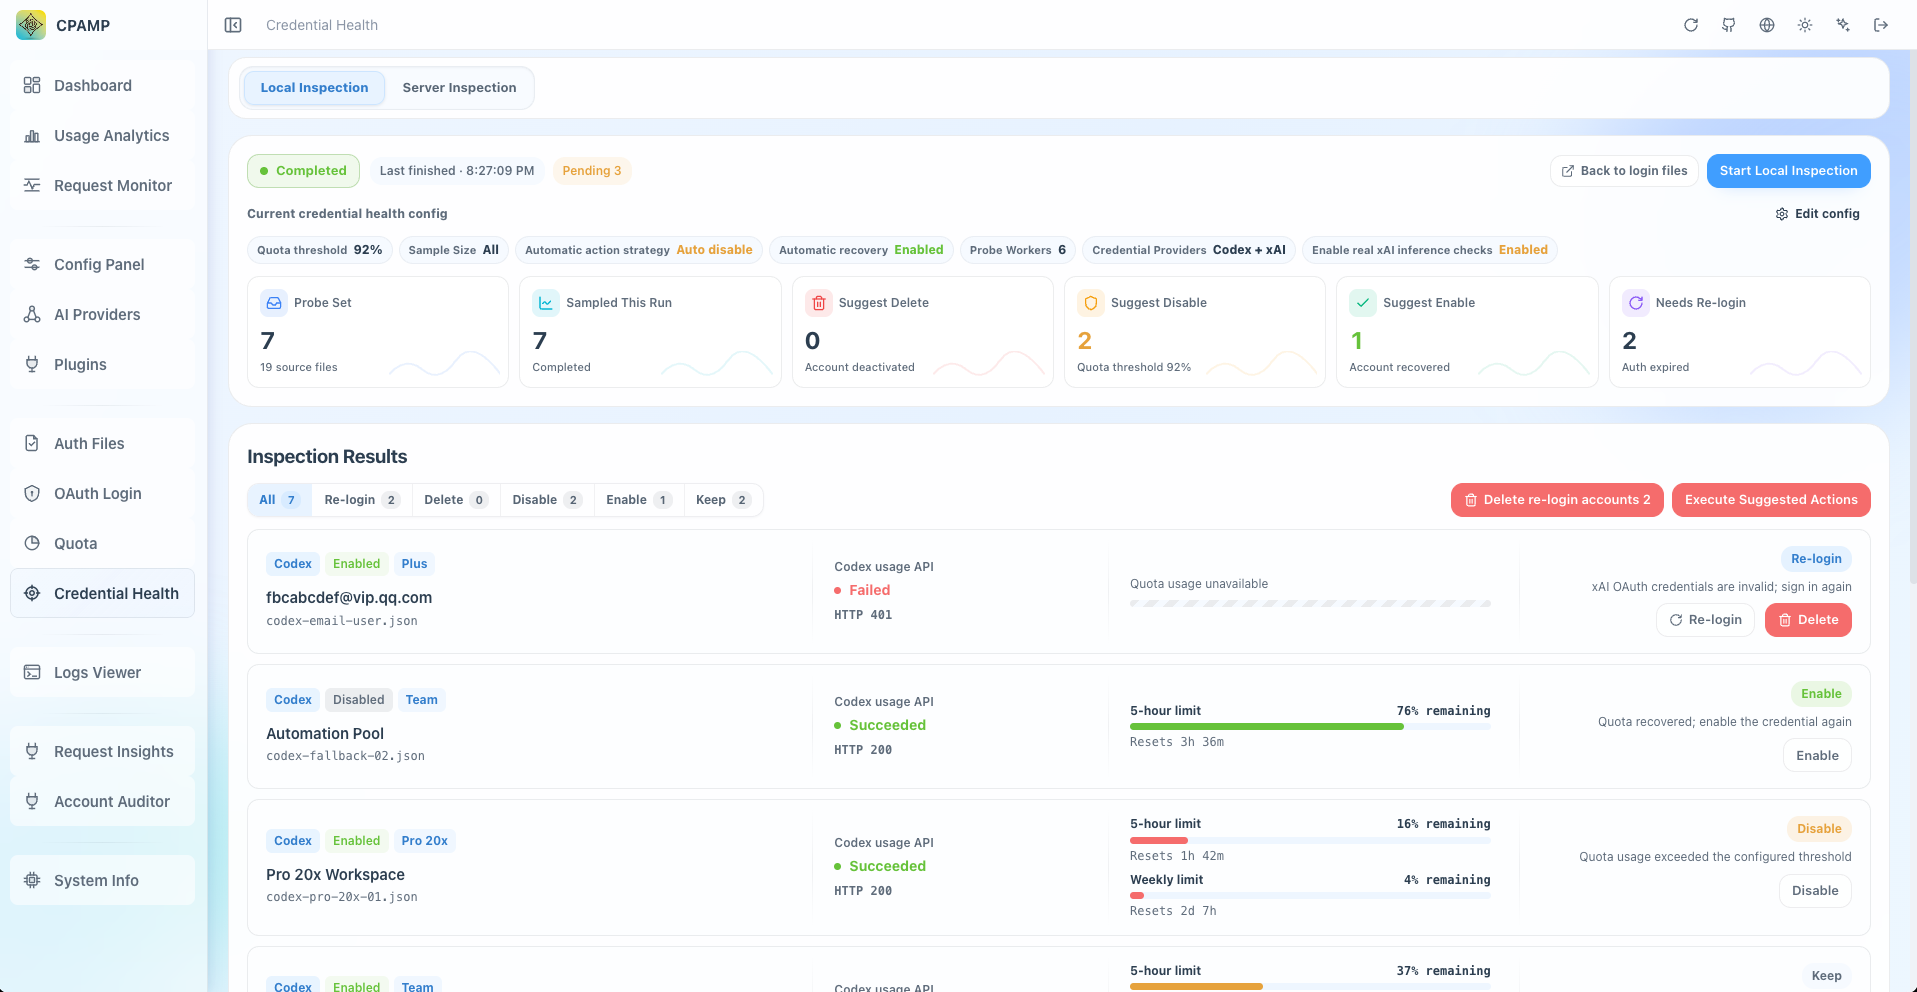
When working with a pool of Codex and xAI accounts, you often hit request window limits. CPAMP can check account status on a schedule, read quota state, and automatically send an account to cooldown when approaching the limit. If an account breaks, it goes into a separate action queue for manual review or recovery.
How to Launch
The easiest way to deploy the CPA and manager bundle is via Docker Compose. Create a configuration file:
services:
  cli-proxy-api:
    image: eceasy/cli-proxy-api:latest
    restart: unless-stopped
    ports:
      - '8317:8317'
    volumes:
      - cpa-data:/app/data

  cpa-manager-plus:
    image: seakee/cpa-manager-plus:latest
    restart: unless-stopped
    ports:
      - '18317:18317'
    volumes:
      - cpa-manager-plus-data:/data

volumes:
  cpa-data:
  cpa-manager-plus-data:
Start the containers with the command docker compose up -d. After startup, open address http://<host>:18317/management.html, grab the generated admin key from the container logs cpa-manager-plus, and link CPA via URL and master key.
If your proxy is already running separately, the manager can be launched as a standalone container:
docker run -d \
  --name cpa-manager-plus \
  --restart unless-stopped \
  -p 18317:18317 \
  -v cpa-manager-plus-data:/data \
  seakee/cpa-manager-plus:latest
Who It's For
The project is aimed at those who maintain their own neural network gateway for a team or personal scripts. If you're tired of blindly guessing why a pipeline failed and which colleague burned through the entire daily token limit, CPAMP solves the problem without extra hassle with external monitoring services. The database spins up in a couple of minutes, doesn't require ClickHouse or Grafana setup, and immediately gives you a clear picture of what's happening.
Related projects