How Microsoft Solves Crooked AI-Generated Charts with Flint
If you've ever asked Claude, ChatGPT, or a local model to generate a chart using ECharts or Chart.js, you've probably encountered a mess of axes and unreadable labels. Models spend hours mixing up keys in JSON configs, breaking layouts, and require bulky system prompts just to draw a simple bar chart.
The Microsoft Research team, in collaboration with researchers from the IDEAS lab at Renmin University of China, has released the flint-chart repository as open source. This is a compact intermediate language and compiler specifically designed for working with LLMs and AI agents.
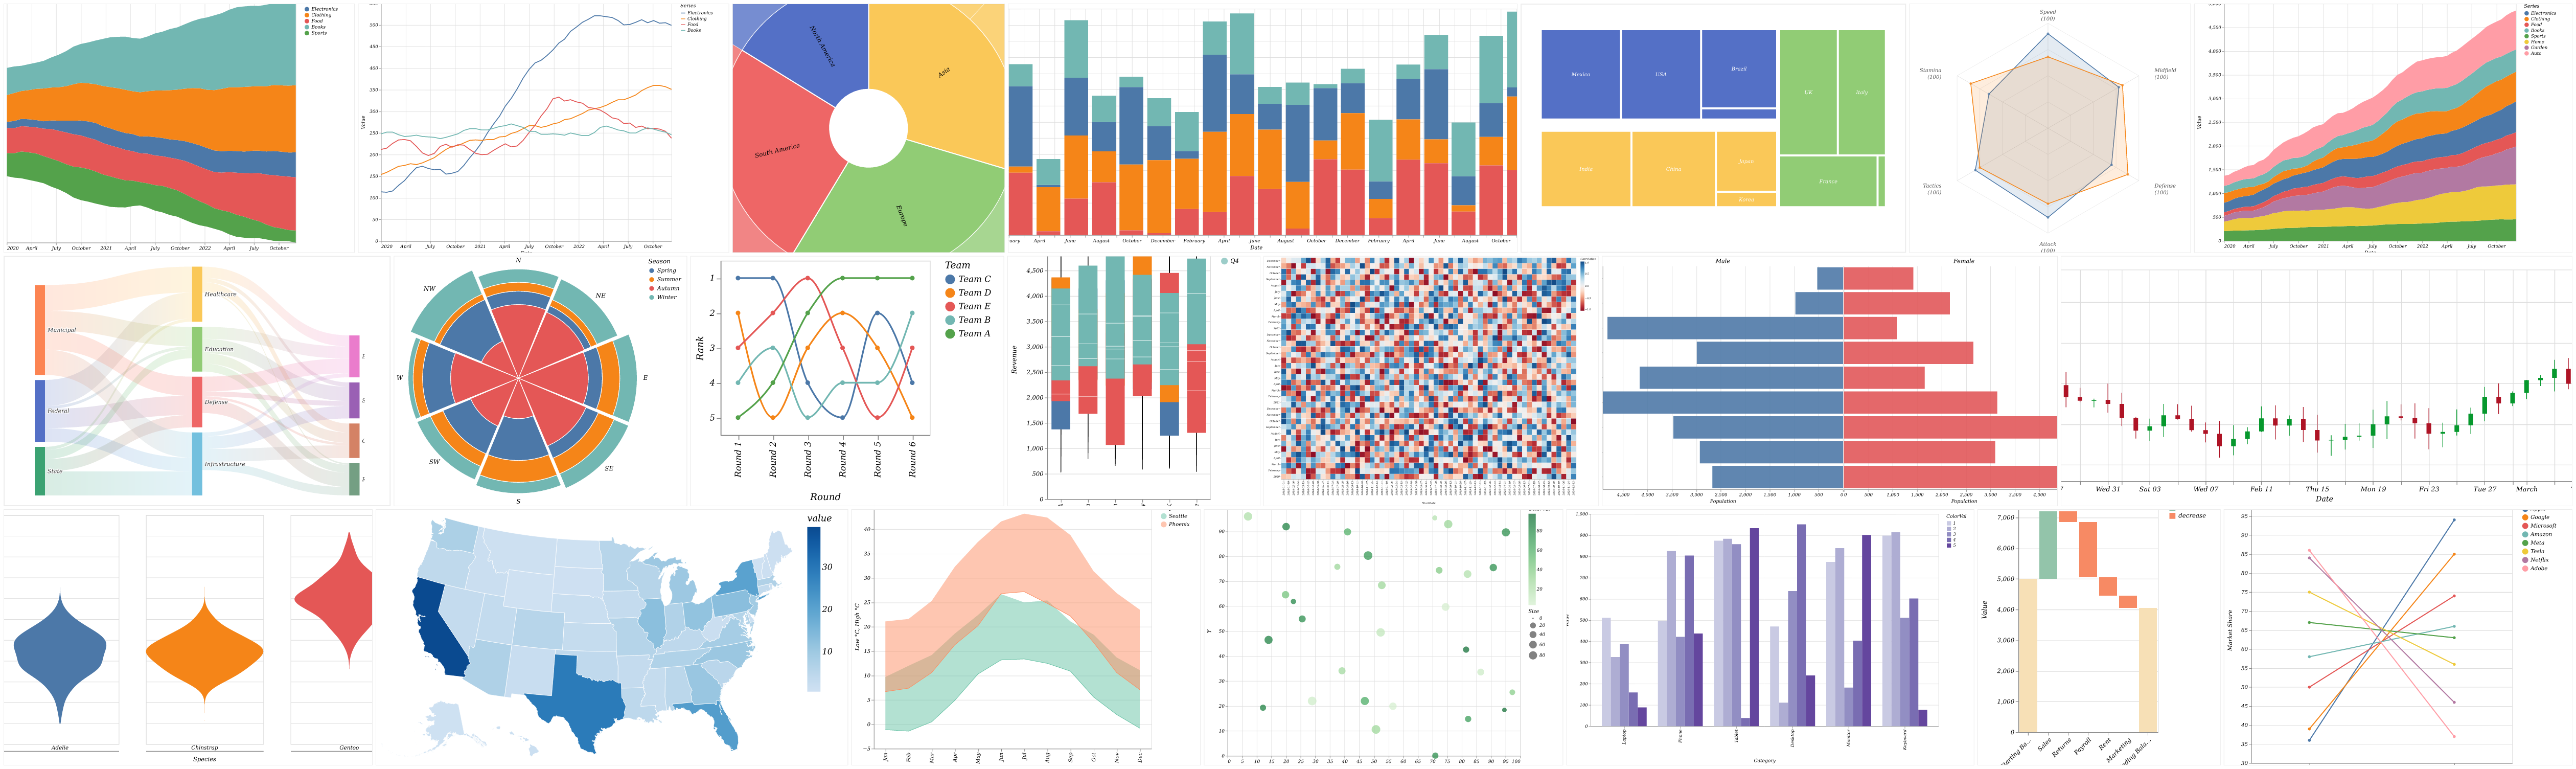
Why Another Visualization Format
The problem with popular libraries like D3, ECharts, or Plotly is their sheer complexity. Configuring a single chart in ECharts requires passing a massive object with dozens of nested fields: scales, axis intervals, padding, legend formatting, and adaptive rules. For an LLM, this is an overly complex task where hallucinations or syntax errors easily occur.
Flint works differently. It takes on the role of an intermediate representation (IR). The neural network generates a concise specification that only specifies the essentials: chart type, input data, and field mapping.
The Flint compiler takes this compact schema, automatically calculates optimal element sizes, formats axes, removes text overlaps, and translates the result into native code for the target graphics library.
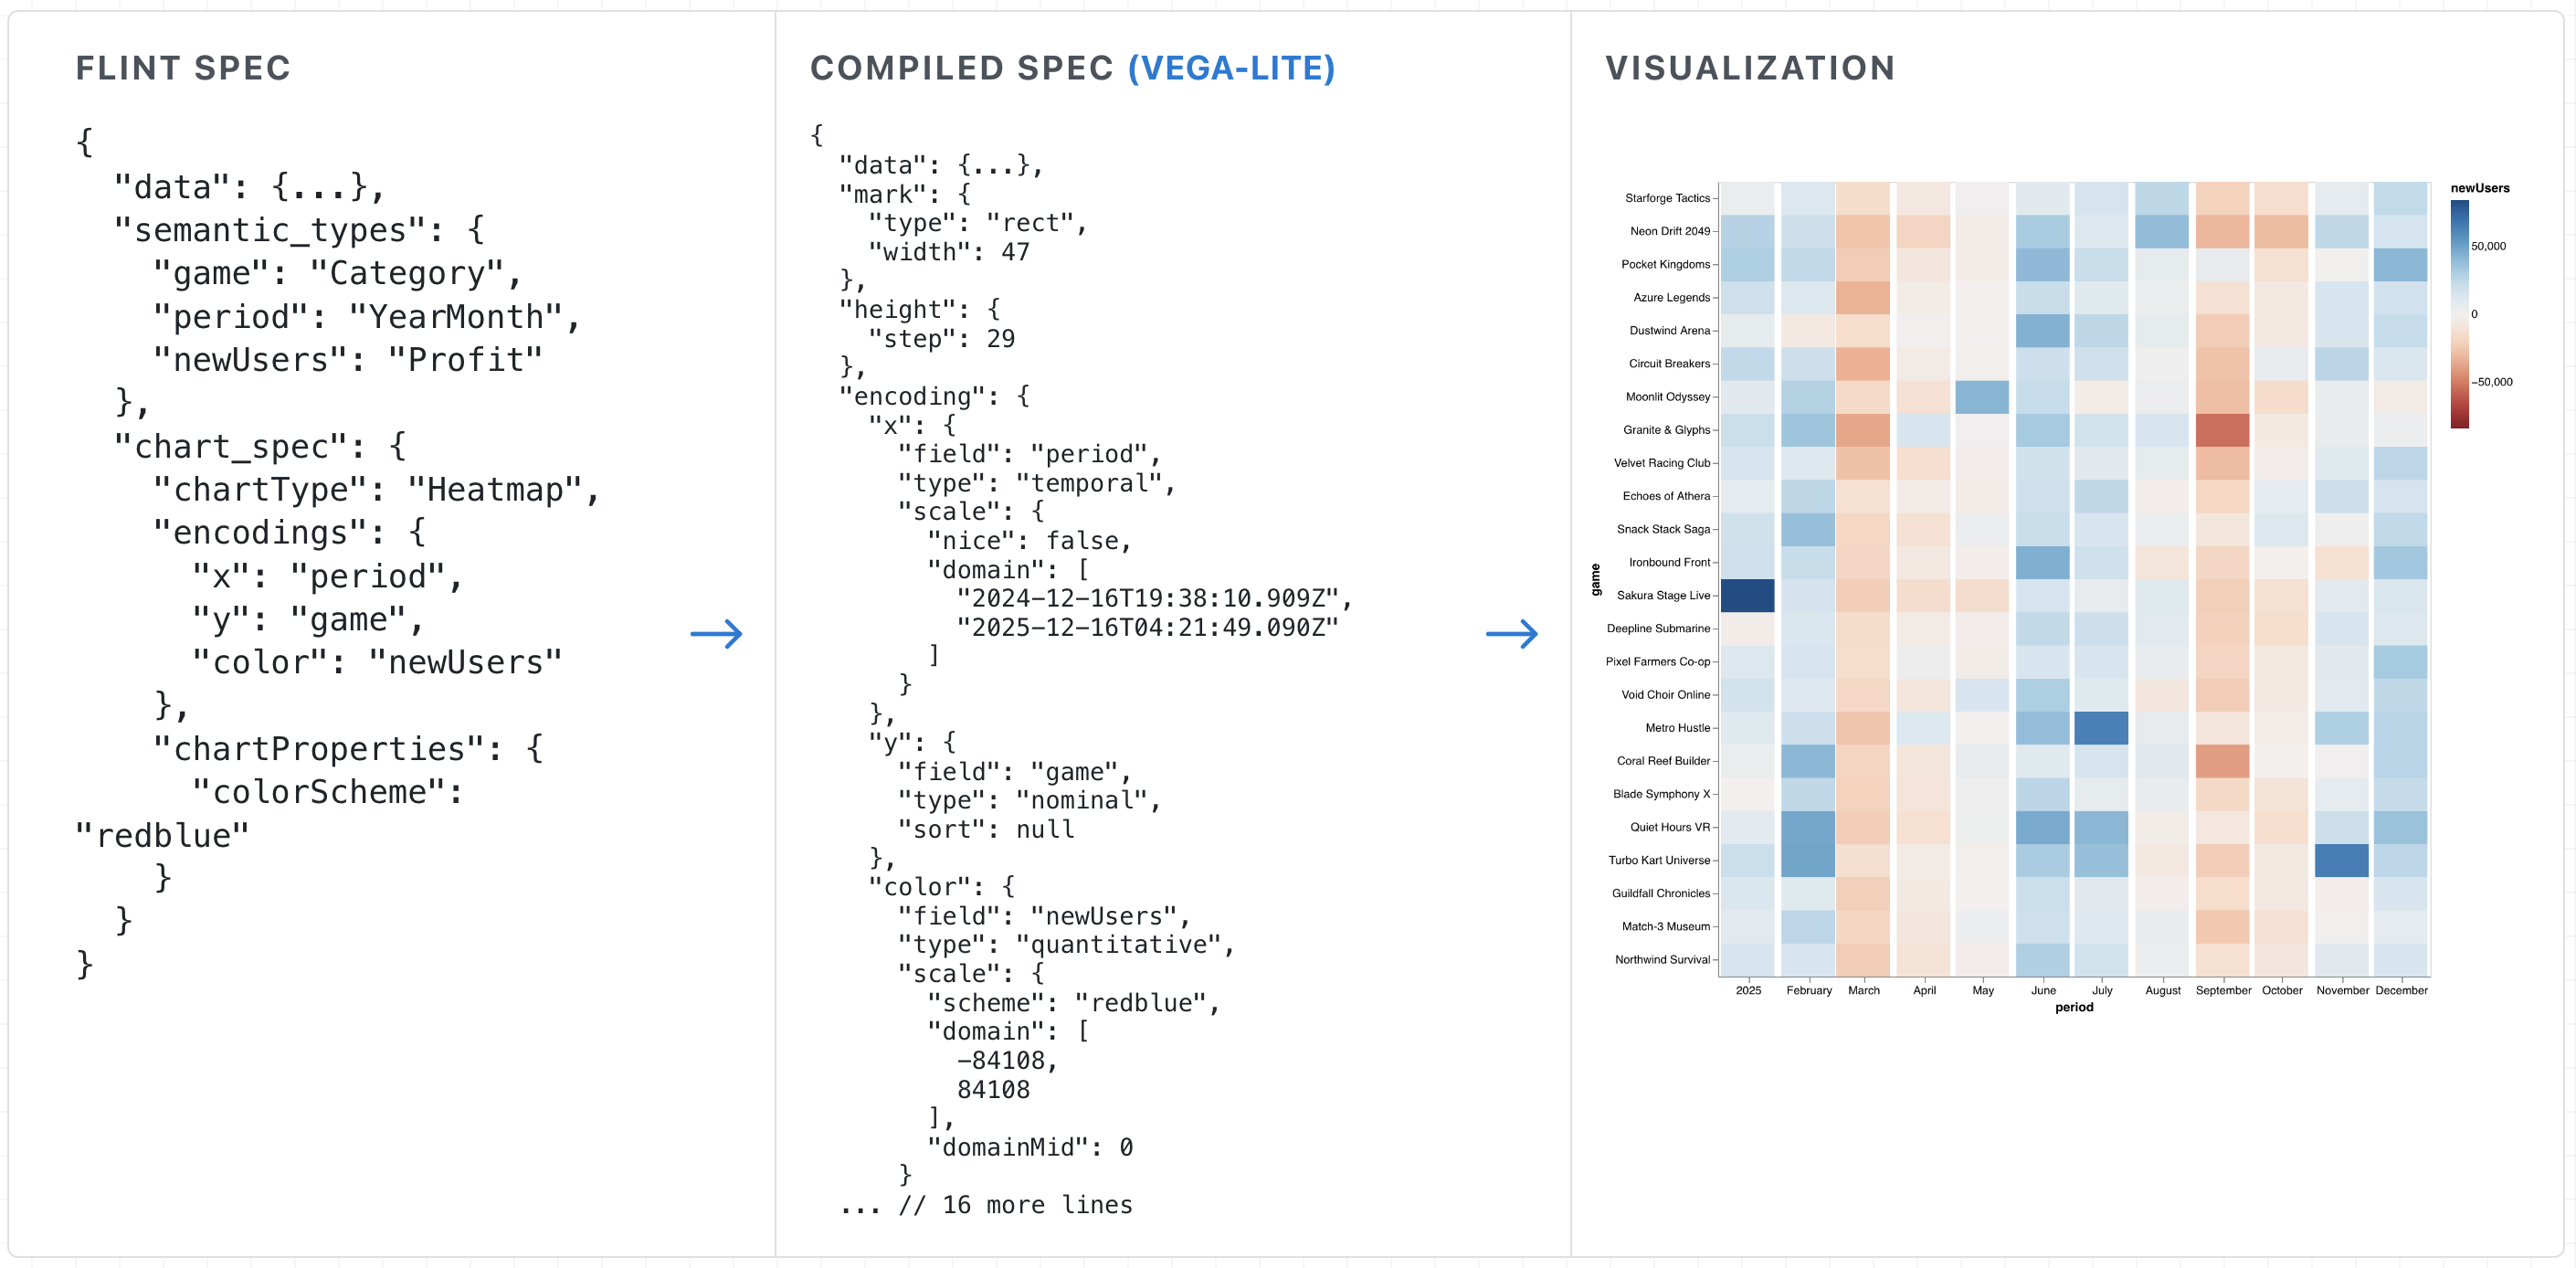
Under the Hood
Unlike standard libraries where fields are divided into plain strings and numbers, Flint uses semantic typing. The system has over 70 semantic types built in, including Rank, Temperature, Price, Country, and Quantity.
When the compiler knows a field contains Price data, it automatically applies currency formatting rules and selects the appropriate scale. If the data specifies countries or ratings, Flint determines the best axis label placement to prevent overlap.
Currently, the library is maintained in the JS/TS ecosystem and can translate the same specification into five different targets:
- Vega-Lite
- ECharts
- Chart.js
- Plotly
- Native Excel charts via Office.js
Here's an example of compiling a specification to Vega-Lite:
import { assembleVegaLite } from 'flint-chart';

const spec = assembleVegaLite({
  data: { values: myData },
  semantic_types: { weight: 'Quantity', mpg: 'Quantity', origin: 'Country' },
  chart_spec: {
    chartType: 'Scatter Plot',
    encodings: { x: { field: 'weight' }, y: { field: 'mpg' }, color: { field: 'origin' } },
    baseSize: { width: 400, height: 300 },
  },
});
If you decide to switch the rendering engine to ECharts or Plotly, you won't need to change the specification code itself. Simply call assembleECharts(input) or assemblePlotly(input).
AI Agent Integration via MCP
The developers prioritized readiness for autonomous agent workflows. The repository includes a flint-chart-mcp server that implements the Model Context Protocol.
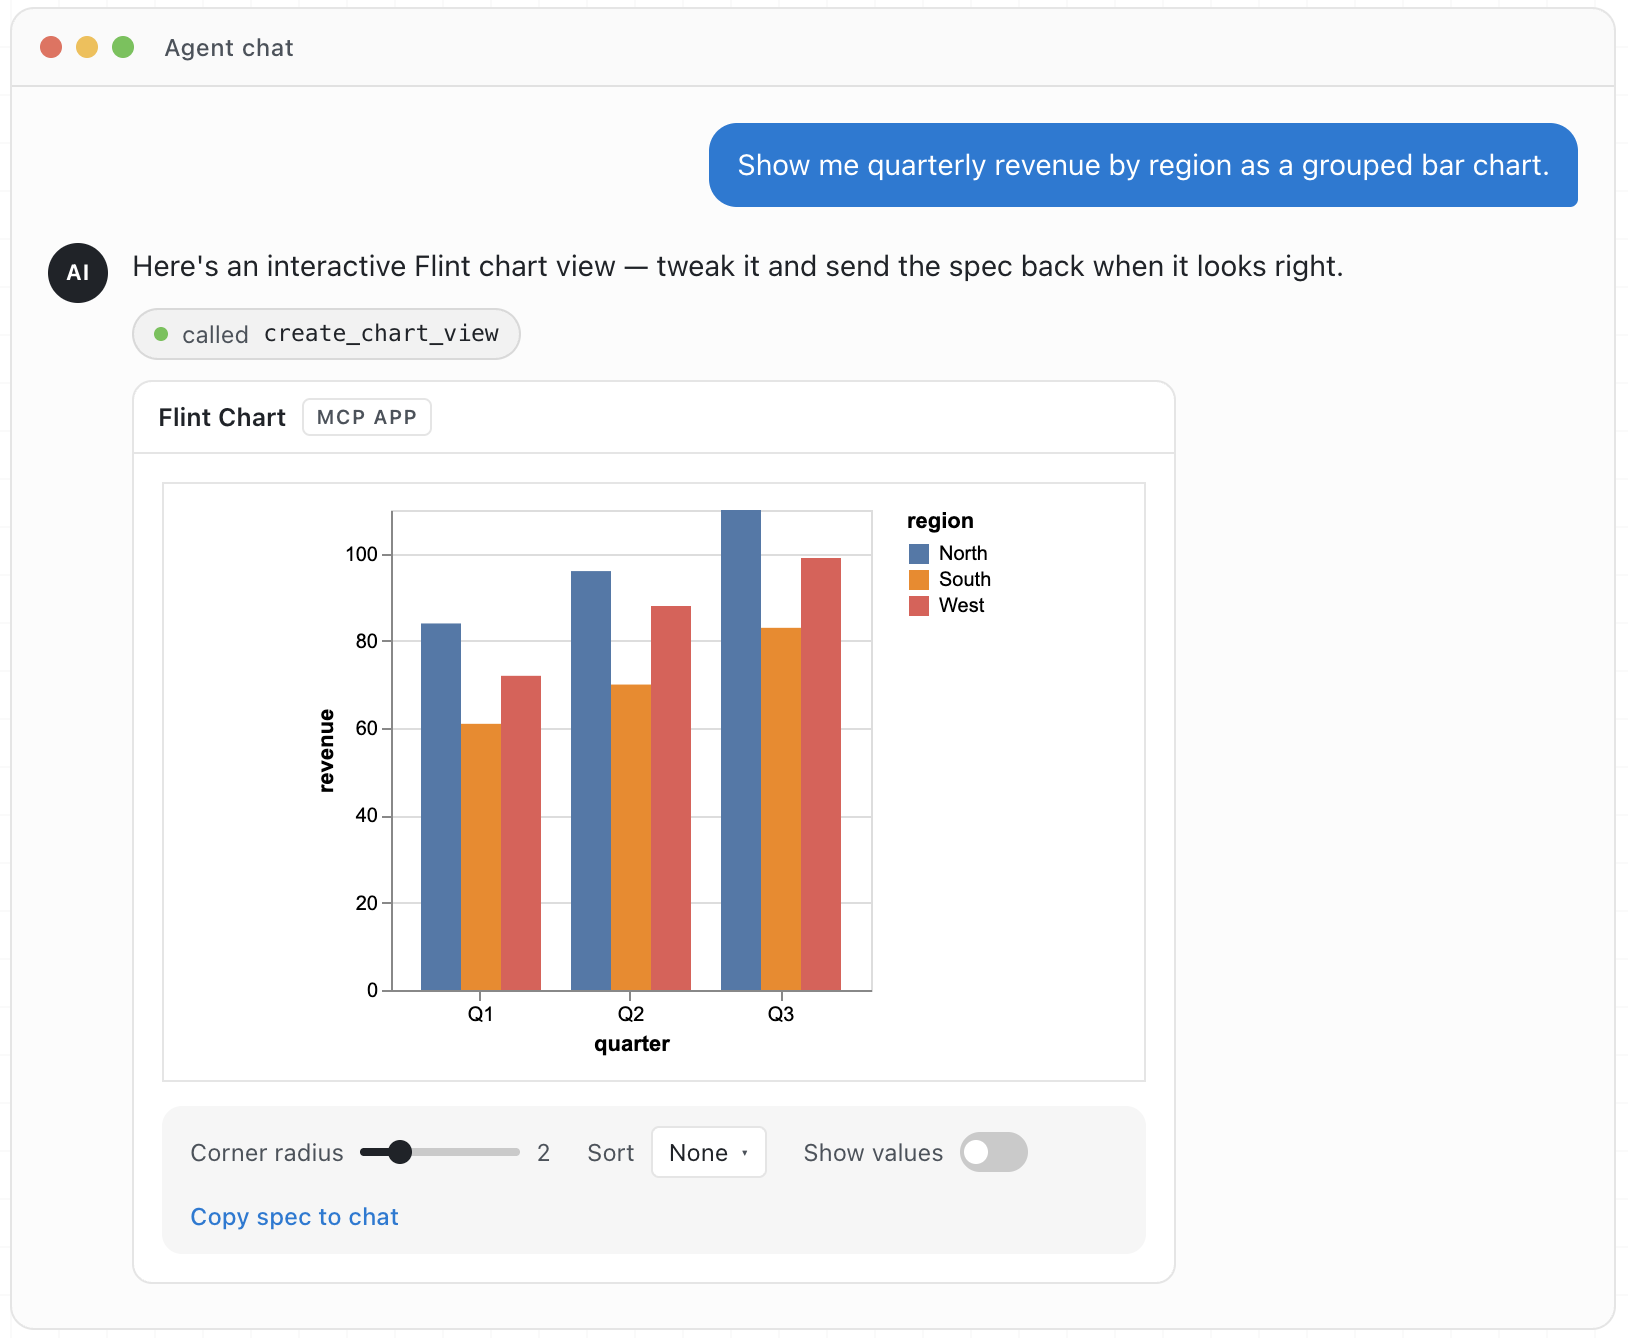
In an MCP-enabled development environment (such as Cursor or Claude Desktop), the agent gets a ready-made toolkit for chart generation. The model doesn't just dump JSON into the chat—it validates the schema, checks types, and immediately renders an interactive widget in the editor interface.
Starting the server in your working environment takes just one command:
npx -y flint-chart-mcp
Repository Structure
The project is structured as a monorepo:
packages/flint-js— the main library code in TypeScript.packages/flint-mcp— the MCP server implementation for agents.packages/flint-py— a Python port prototype (currently available as source code only, the package hasn't been published to PyPI yet).site— an interactive demo site with an editor and gallery.
If you want to explore the project locally and make changes, deployment takes just a couple of minutes:
git clone https://github.com/microsoft/flint-chart
cd flint-chart
npm install
npm run site
The demo client will start at http://localhost:5274/. The library code is directly linked to the site, so changes to the compiler logic are pulled in on the fly without manually rebuilding packages.
Who Is Flint For
The tool addresses a narrow but painful problem. If you're building AI assistants, dashboards with on-the-fly generation, or giving neural networks access to data analytics, Flint eliminates the need to write numerous validators and workarounds around visualizations.
The project is still fresh, but it has Microsoft Research behind it, and updates come regularly. Version 0.4.0 added support for dozens of Plotly templates and editable Excel charts, so the library is definitely worth bookmarking.
Related projects