GeoLibre: how to run GIS in browser, Jupyter and desktop without installing heavy software
If you've ever worked with spatial data, you know the standard situation. Need to quickly look at a GeoJSON or run a couple of spatial queries against a Parquet file — and you open QGIS. The application loads, pulls in modules, and for basic visualization you end up spending a couple of gigabytes of RAM and time configuring layers.
Developers from the OpenGeos community decided to approach the problem from a different angle. They created GeoLibre — a lightweight platform for working with geospatial data that runs directly in the browser, inside Jupyter notebooks, and as a standalone desktop application.
What's under the hood
The project architecture combines several modern web technologies. The frontend is built with React and TypeScript. MapLibre GL JS and deck.gl handle 2D and 3D map rendering.
The most interesting part happens during data processing. Instead of sending heavy geospatial files to external servers, GeoLibre uses DuckDB-WASM with the spatial extension. The file is processed on the client side. You drag a GeoJSON or Parquet file into the browser window, and the local DuckDB executes SQL queries directly in your device's memory.
Desktop and mobile versions are built with Tauri v2. This results in a compact distribution size and low resource consumption compared to traditional Electron-based solutions.
Practical capabilities
The tool covers most everyday tasks for geo-analysts and developers.
Local Spatial SQL in the browser
DuckDB-WASM enables writing spatial SQL queries without spinning up PostgreSQL with PostGIS. You can perform layer joins, calculate buffer zones, and aggregate data directly in the application interface.
Working with 3D data and time scales
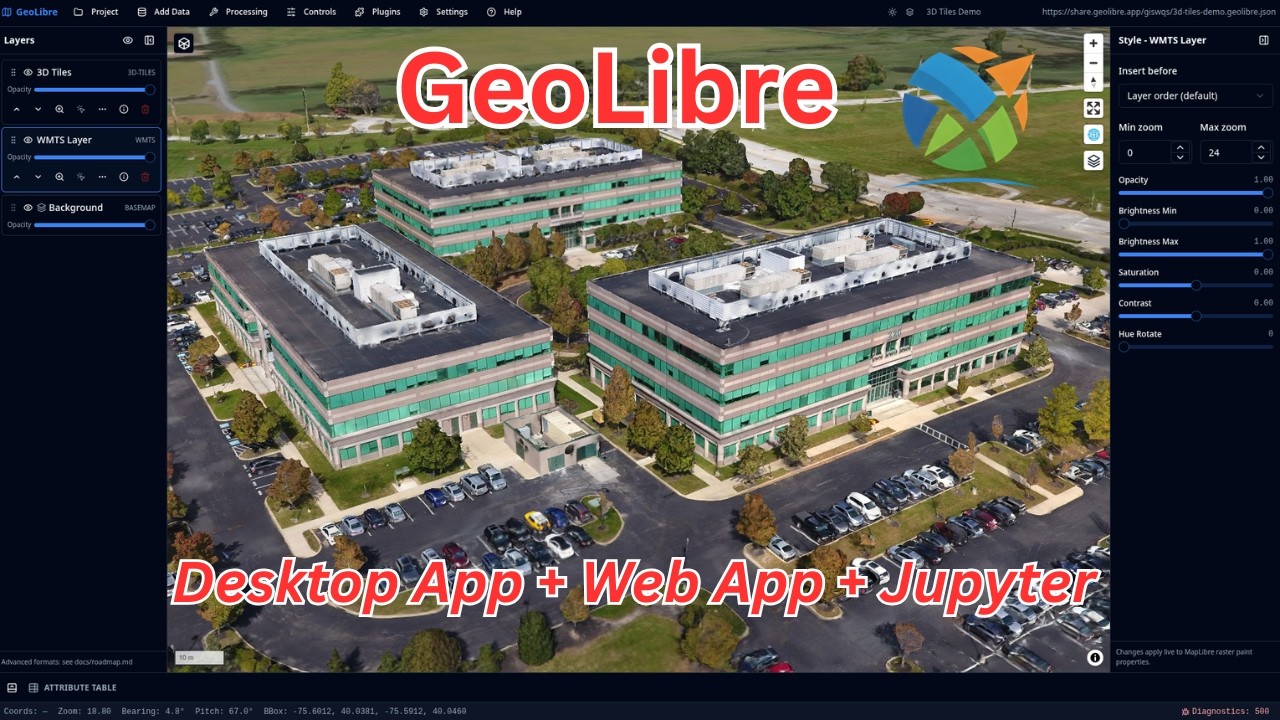
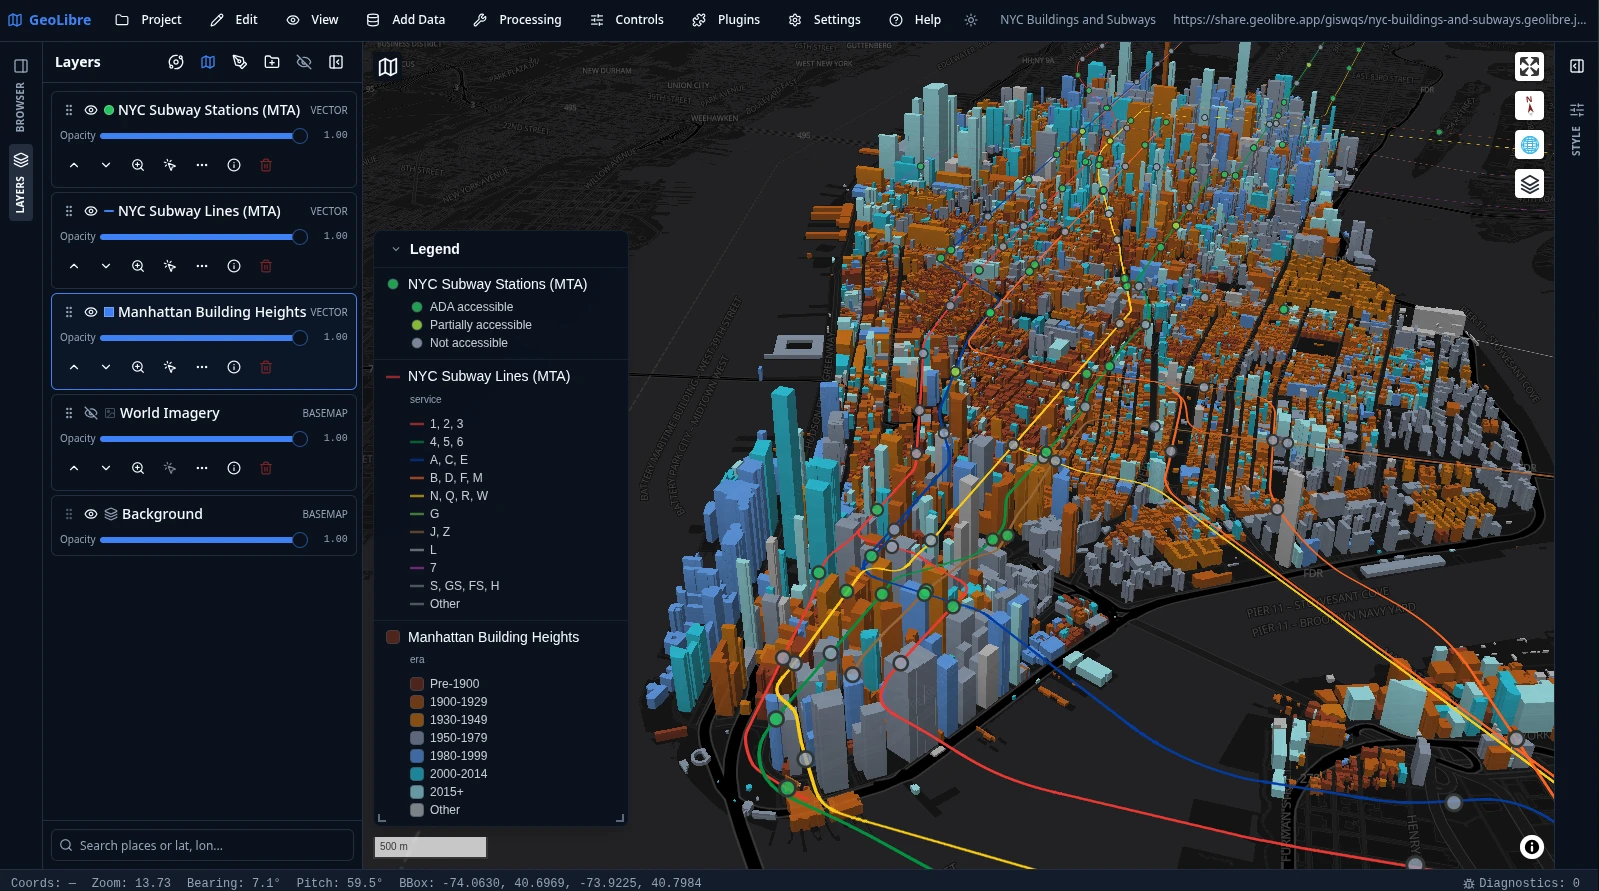
GeoLibre supports working with 3D Tiles and volumetric vector objects. A clear example from the project's demo materials is a 3D map of Manhattan buildings.
Each building is extruded by height and colored based on the year of construction. Using the built-in time slider, you can play an animation and watch how the city was built up from 1850 to 2025.
Mapping other planets
The project's creators didn't limit themselves to Earth. The platform includes base maps from OpenPlanetaryMap and USGS Astrogeology.
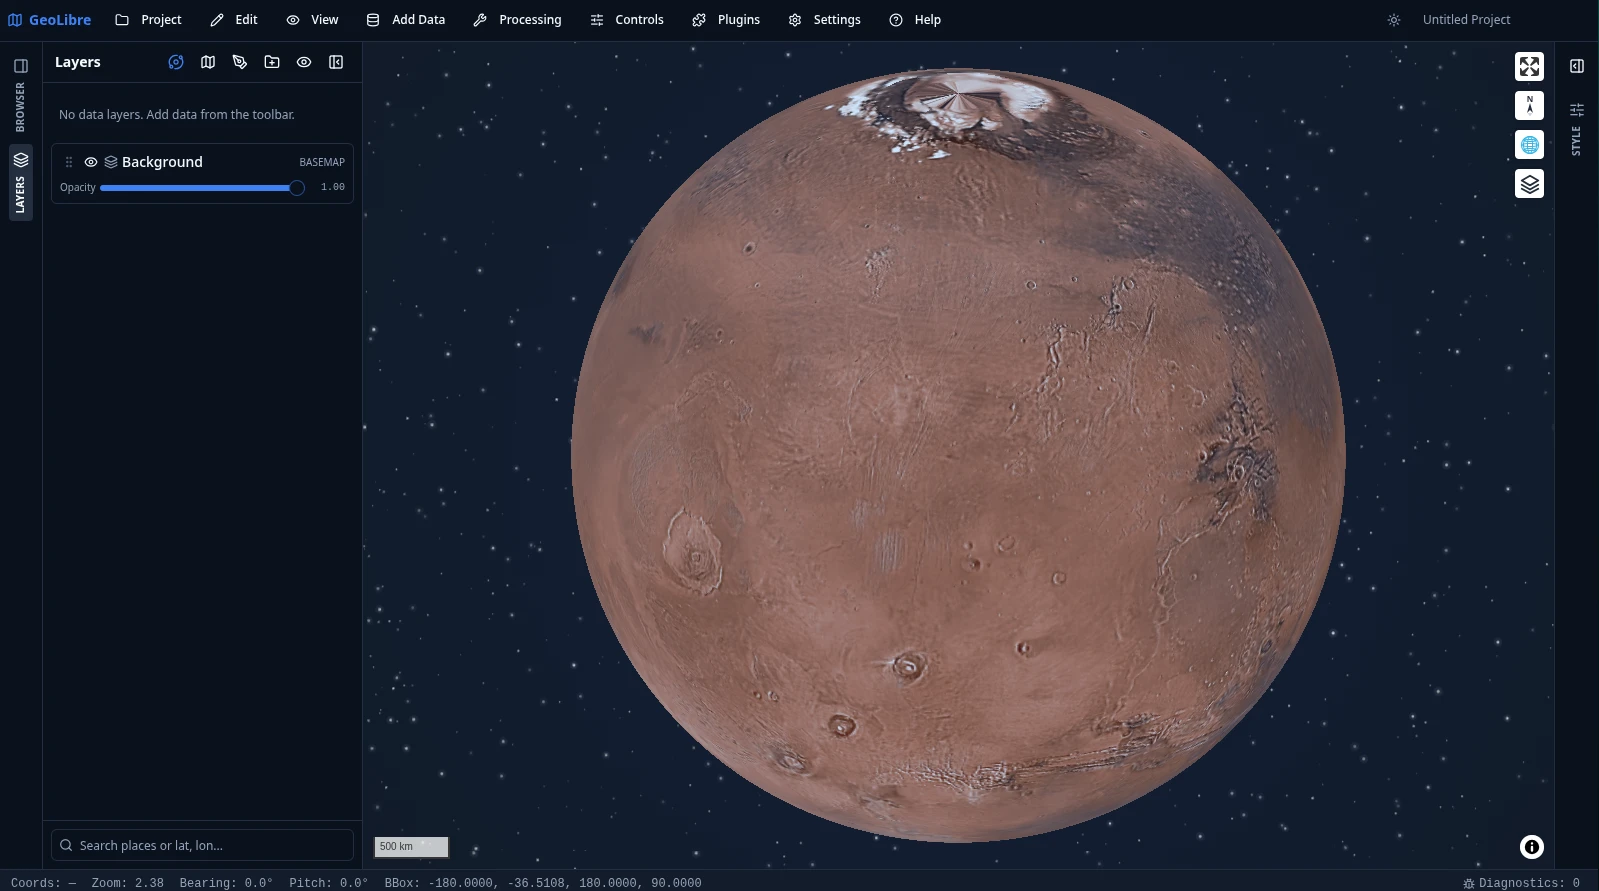
You can switch to the Moon, Mars, Mercury, Venus, or Jupiter's moons. Each celestial body has its own ellipsoid defined, so distance and area calculations remain accurate.
Integration with Python and Jupyter
A separate Python package geolibre is available for data scientists. It lets you embed interactive maps directly into Jupyter Notebook cells. You can pass a Pandas or GeoPandas DataFrame to the widget and immediately get a ready-made cartographic representation.
How to try it out
The fastest way is to open the web version web.geolibre.app. No registration or installation required.
If you're working in Jupyter, the package installs with a standard command:
pip install geolibre
For Conda installation, use the conda-forge repository:
conda install -c conda-forge geolibre
For local desktop application builds for your distribution, you'll need Node.js and Rust:
git clone https://github.com/opengeos/GeoLibre.git
cd GeoLibre
pnpm install
pnpm tauri dev
Who the project is for
GeoLibre is useful for developers, researchers, and data analysts who need a quick tool for inspecting and visualizing geospatial data. It doesn't fully replace heavy GIS tools for complex cartography, but it handles rapid initial processing, prototyping in Jupyter, and demonstrating spatial data directly in a web browser.
Related projects