How to Build a Personal Quant Analysis Terminal with Polars and DuckDB
Any developer who has ever tried to analyze stock quotes with code has inevitably gone through the same scenario. First, you open a Jupyter Notebook, connect Pandas, and pull historical candles through some random free API. Within a couple of days, the notebook grows to hundreds of unreadable cells, indicator calculations start freezing for minutes, and instead of a proper interface you have to squint at Matplotlib charts.
Recently, I came across the project shy3130/tick-stock-panel on GitHub. The author built a complete open-source platform for quant analysis, backtesting, and stock monitoring that you can run locally in a single Docker container. The project is initially tailored for the Chinese A-shares market, but its architectural decisions and tech stack deserve a separate review, regardless of which assets you trade.
What's Inside and How It Works
The main problem with most homemade screeners is performance. If you calculate moving averages, MACD, RSI, and Bollinger Bands for thousands of tickers in a loop through Pandas, the machine quickly chokes.
In tick-stock-panel, this problem was solved with a modern data stack:
- Polars handles parallel indicator calculations and market-wide screening in fractions of a second.
- Parquet is used as the local storage format for enriched tables.
- DuckDB performs fast analytical queries on top of Parquet directly on disk without spinning up heavy databases.
- vectorbt is used in an isolated backtesting module.
- FastAPI and sse-starlette serve data and stream progress of heavy computations via Server-Sent Events.
- React 18 with Lightweight Charts and ECharts libraries forms a clean control panel.
The architecture is compact: the backend and bundled frontend are packed into a two-stage Dockerfile. The application doesn't need external PostgreSQL or Redis—the entire database is kept local.
Main Platform Features
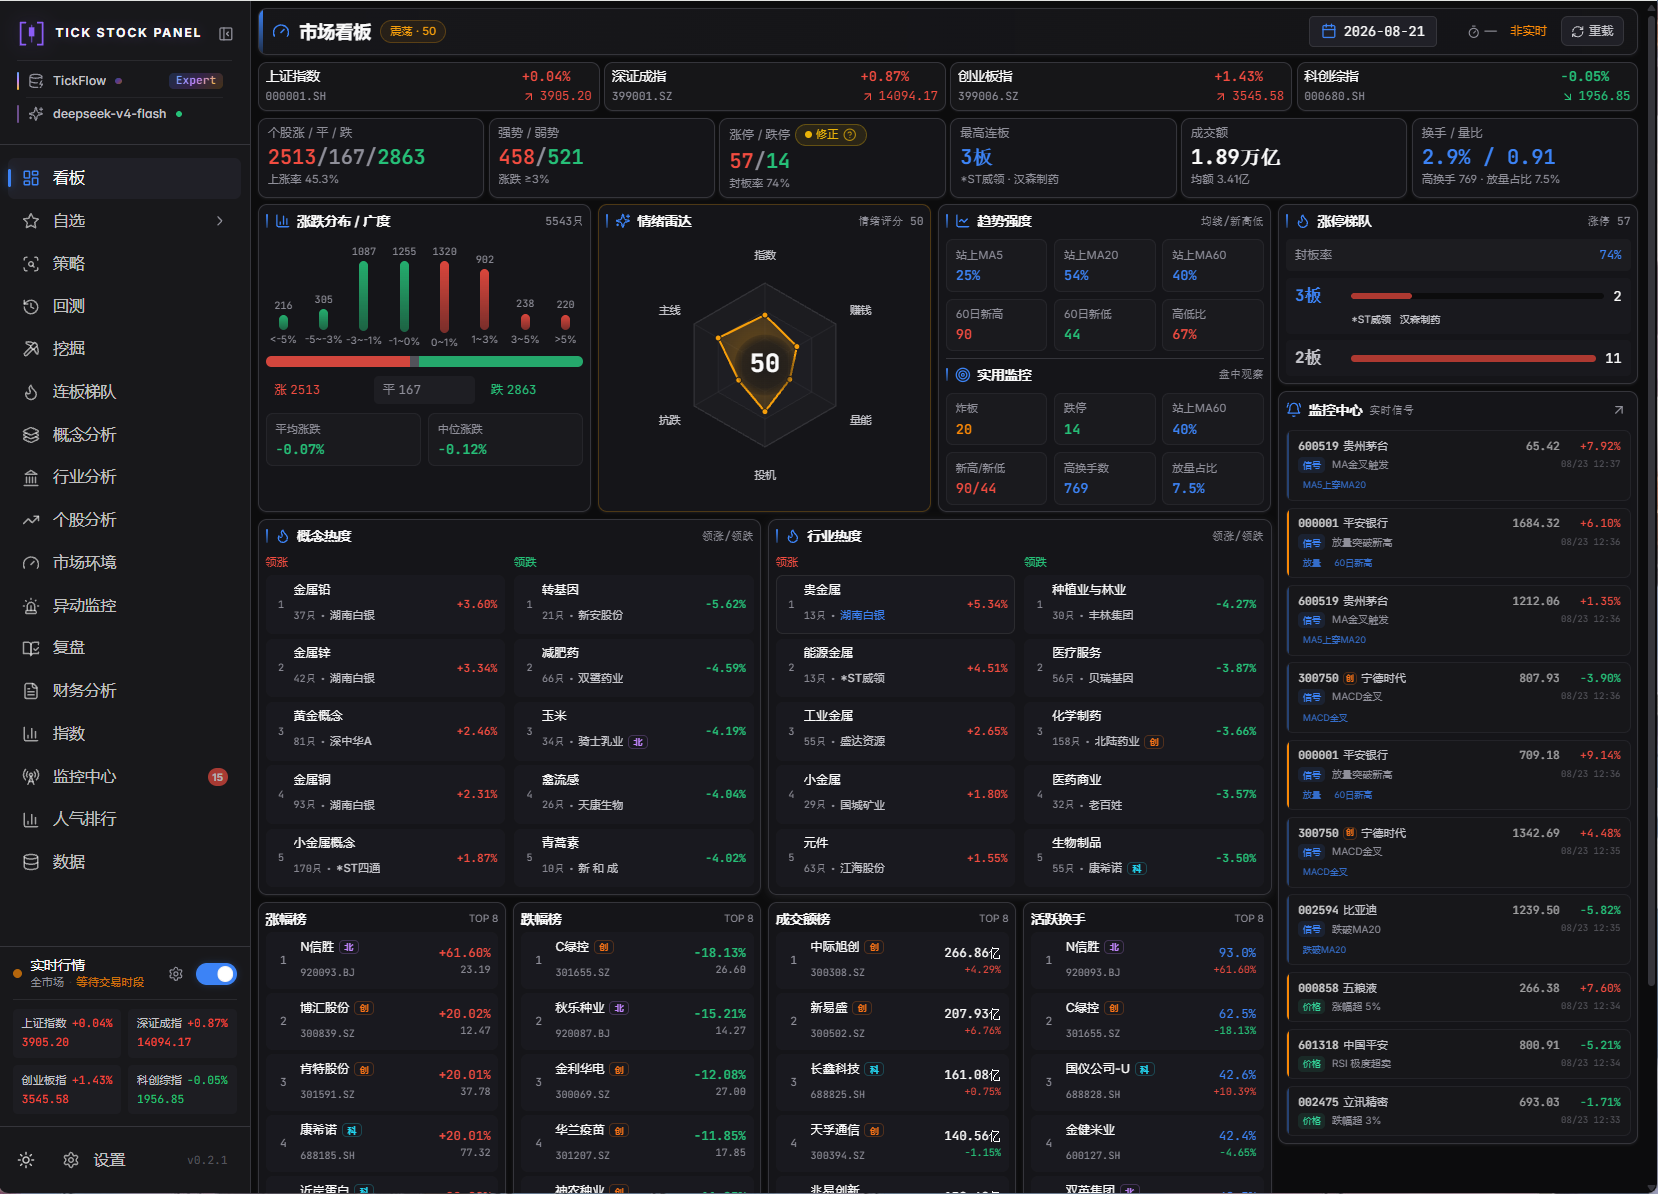
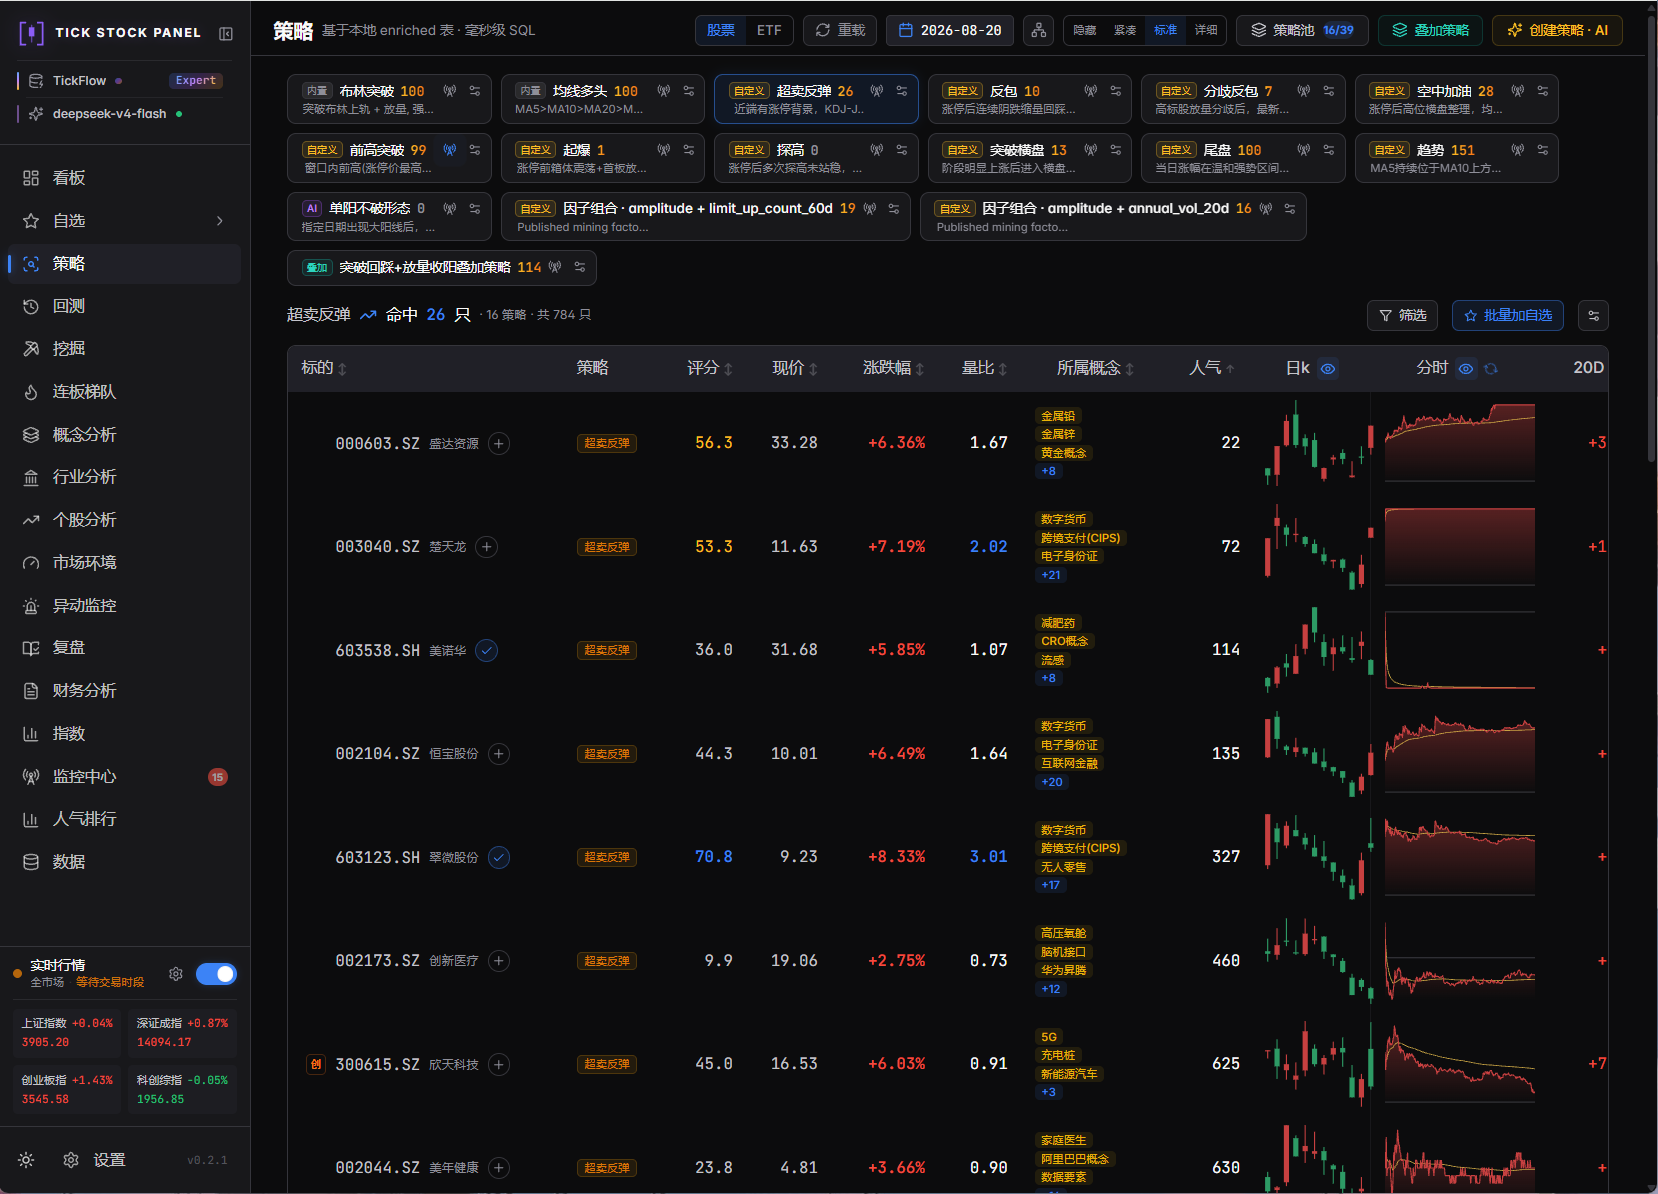
The developer divided the functionality into four key blocks: filtering, hypothesis testing, market tracking, and individual asset analysis.
| Dashboard | Strategy Screener |
 |
 |
| Backtesting | Factor Search |
 |
 |
Screener and Built-in Strategies
The system includes 18 ready-made stock selection strategies. The filtering mechanism runs on Polars: after market close, the pipeline computes an enriched dataset, and the user's query checks conditions across the entire ticker table. You can combine standard indicators, volumes, and candlestick patterns or write your own signals.
Backtesting and Alpha Factor Search
Testing is divided into two modes:
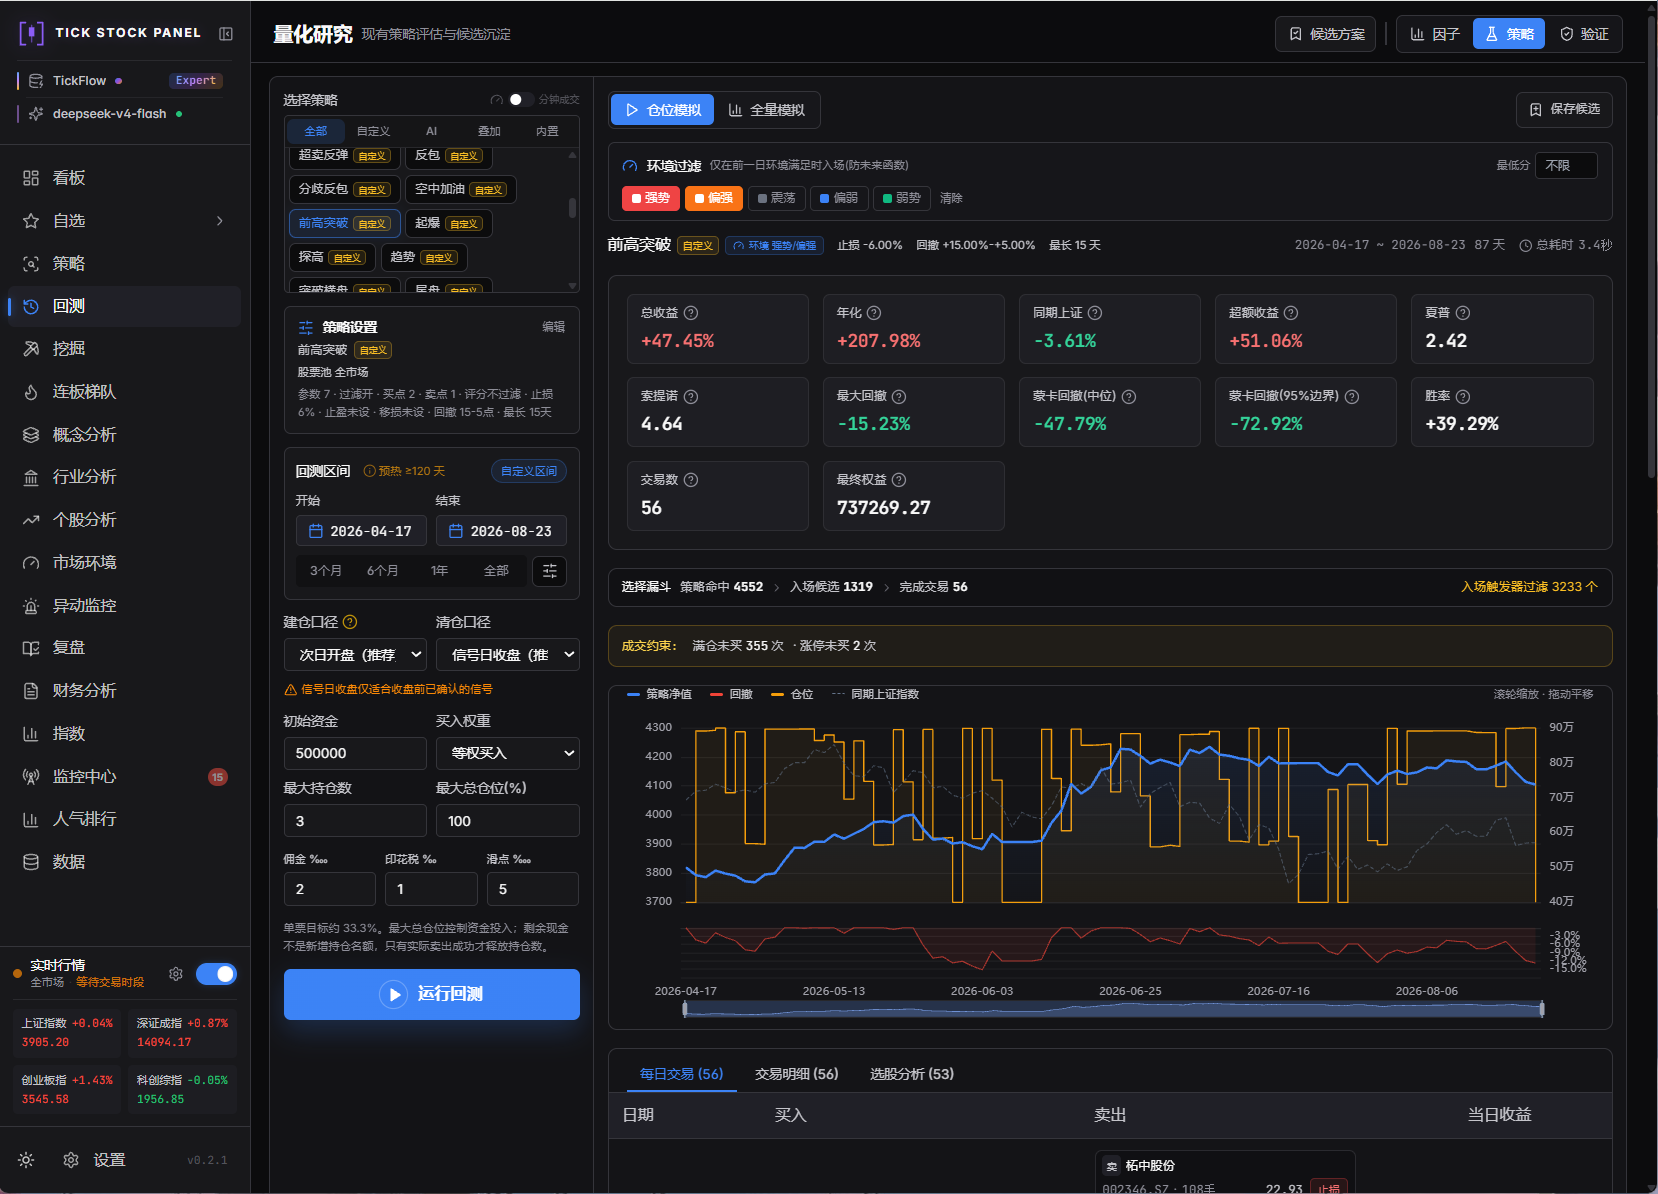
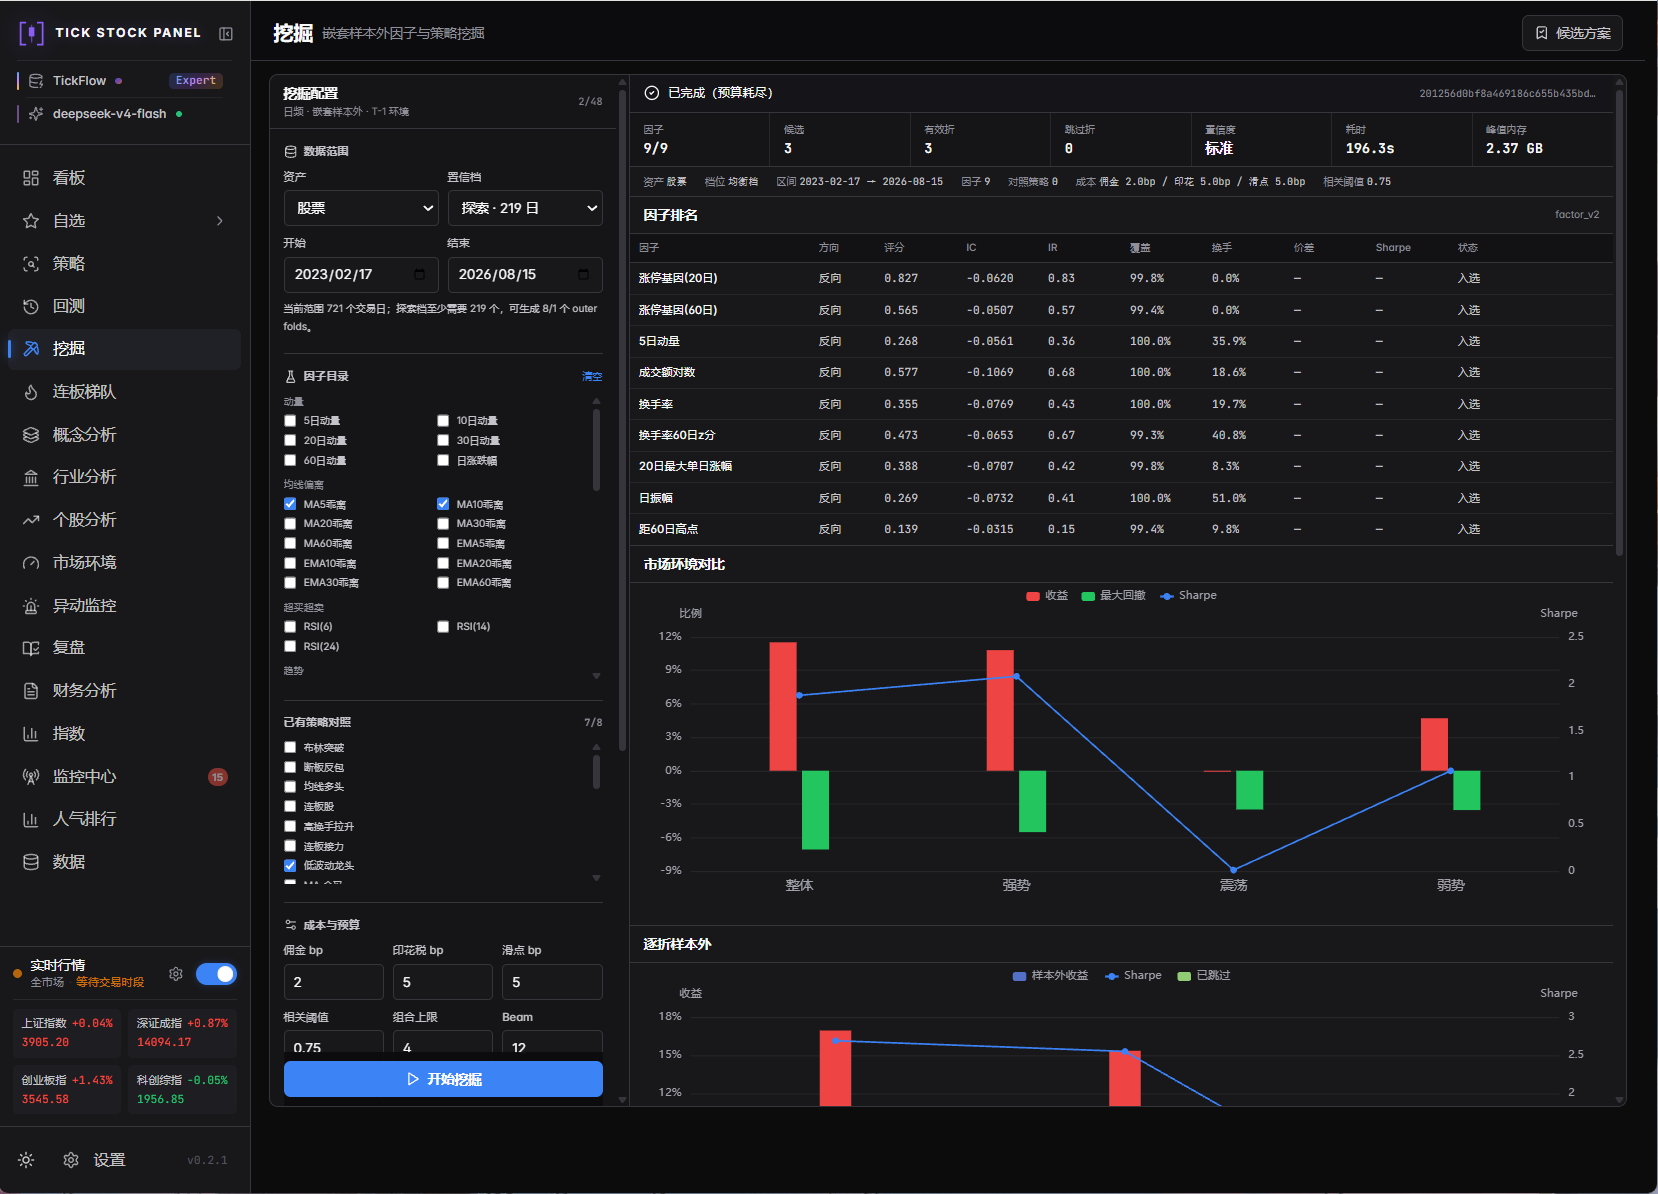
- Individual factor evaluation with IC and IR metric calculations, quantile returns, and long-short spreads. This helps filter out noise before building a trading system.
- Full strategy backtesting with T+1 settlement rules, slippage, broker commissions, and stop-losses.
The factor mining module is implemented interestingly. The system searches for rank combinations on the training set, filters correlated metrics, and validates results on out-of-sample data. However, the discovered rules aren't applied blindly: the candidate is saved to drafts and requires manual confirmation before adding to the working pool.
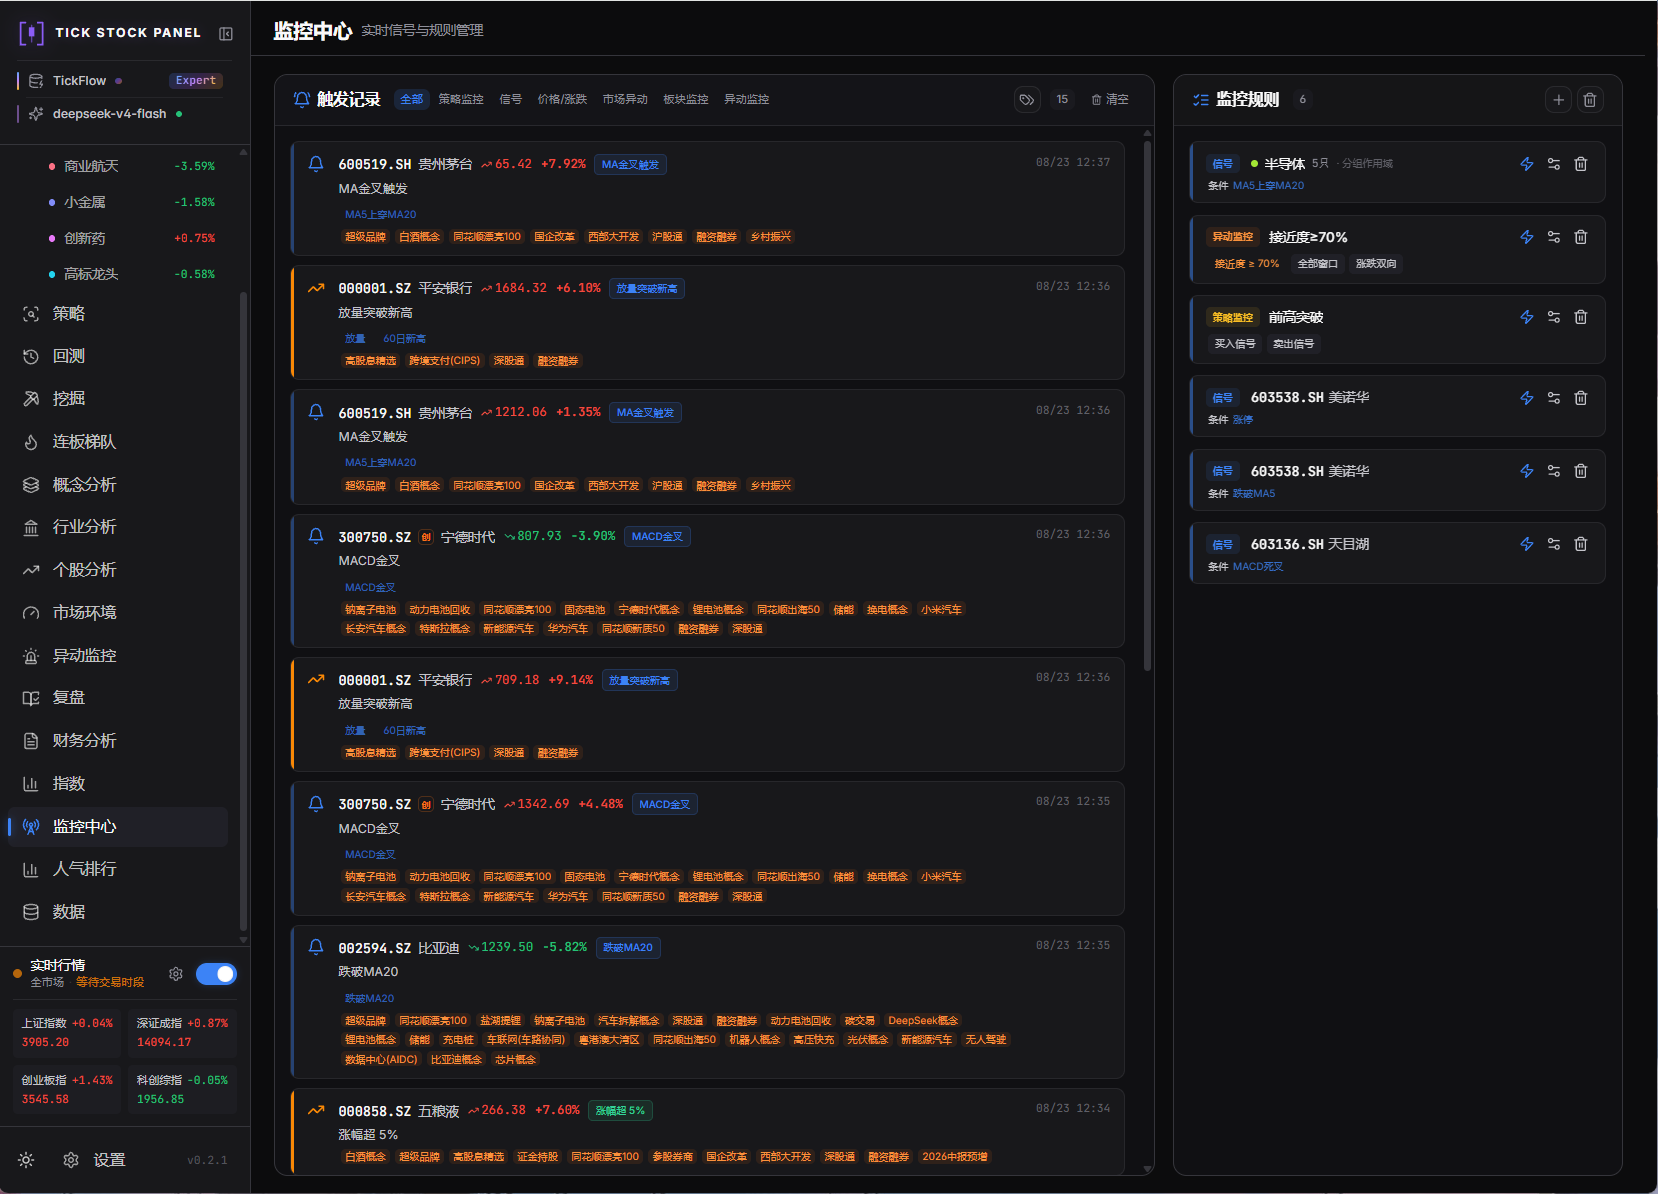
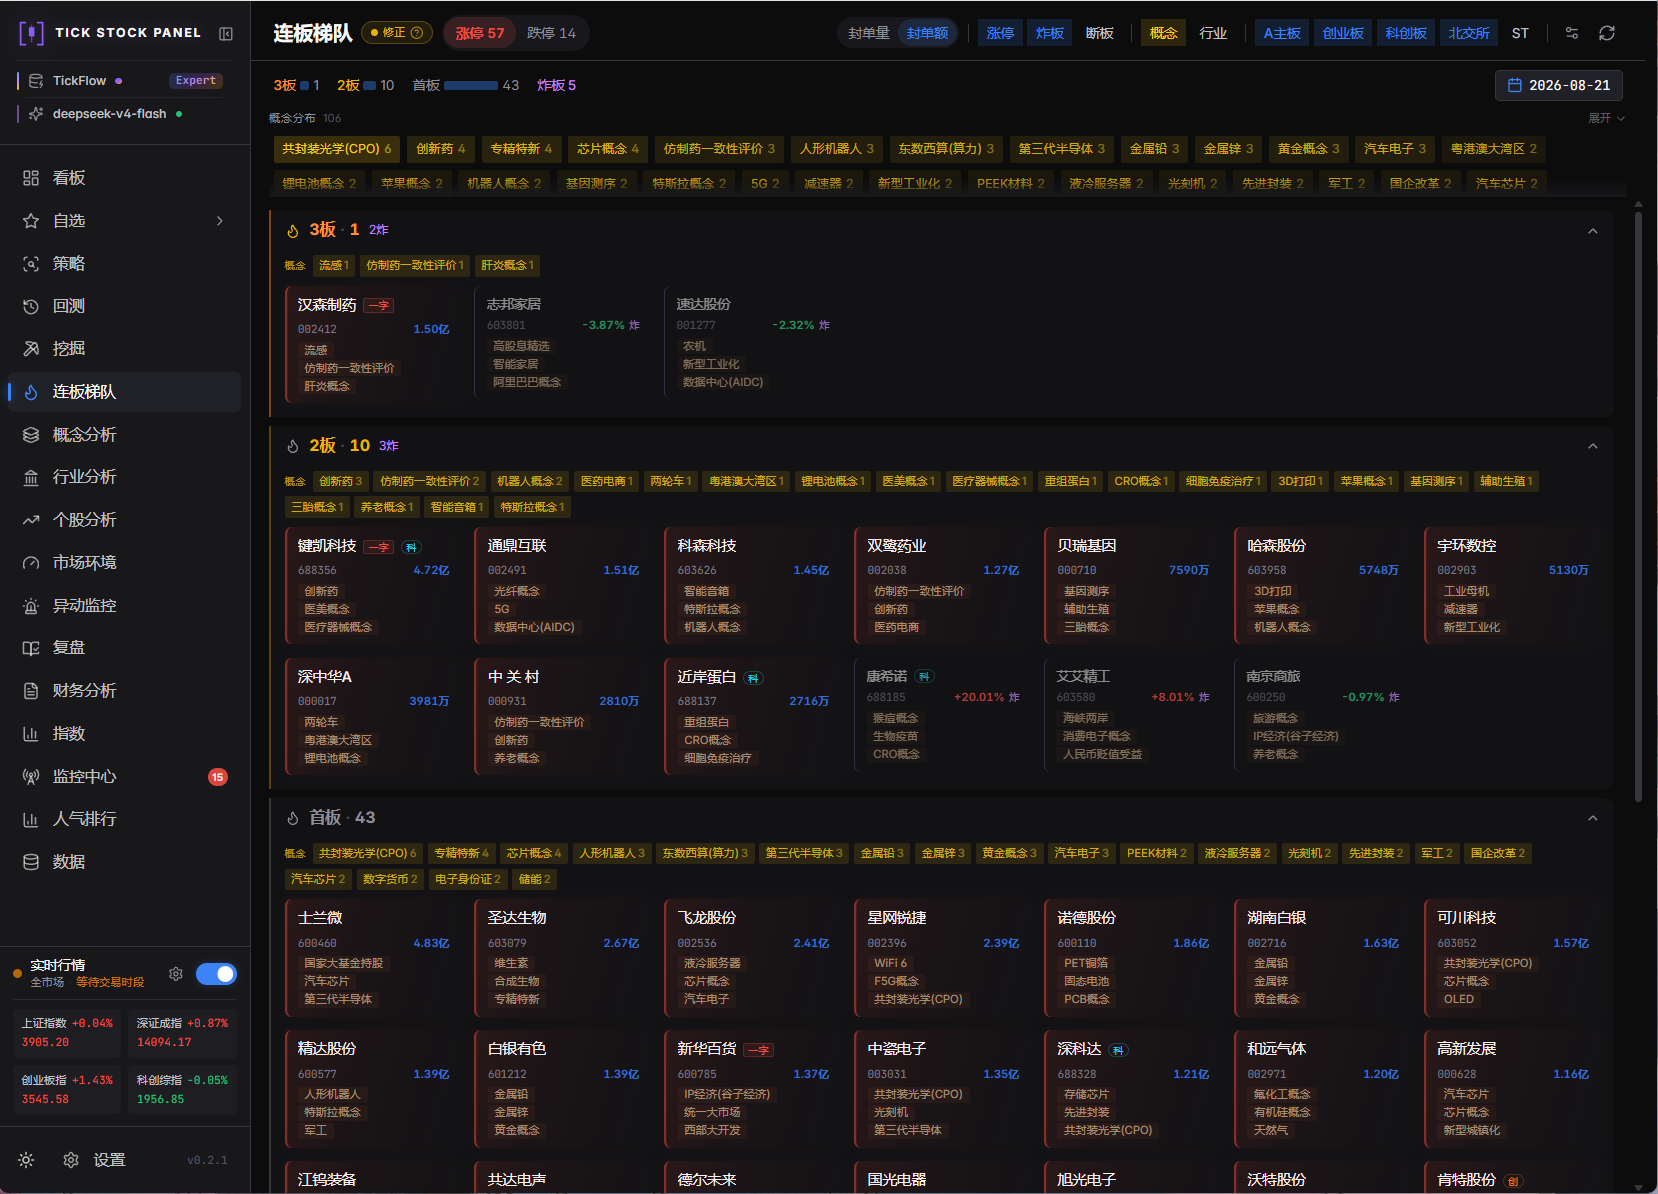
| Monitoring Center | Limit Ladder |
 |
 |
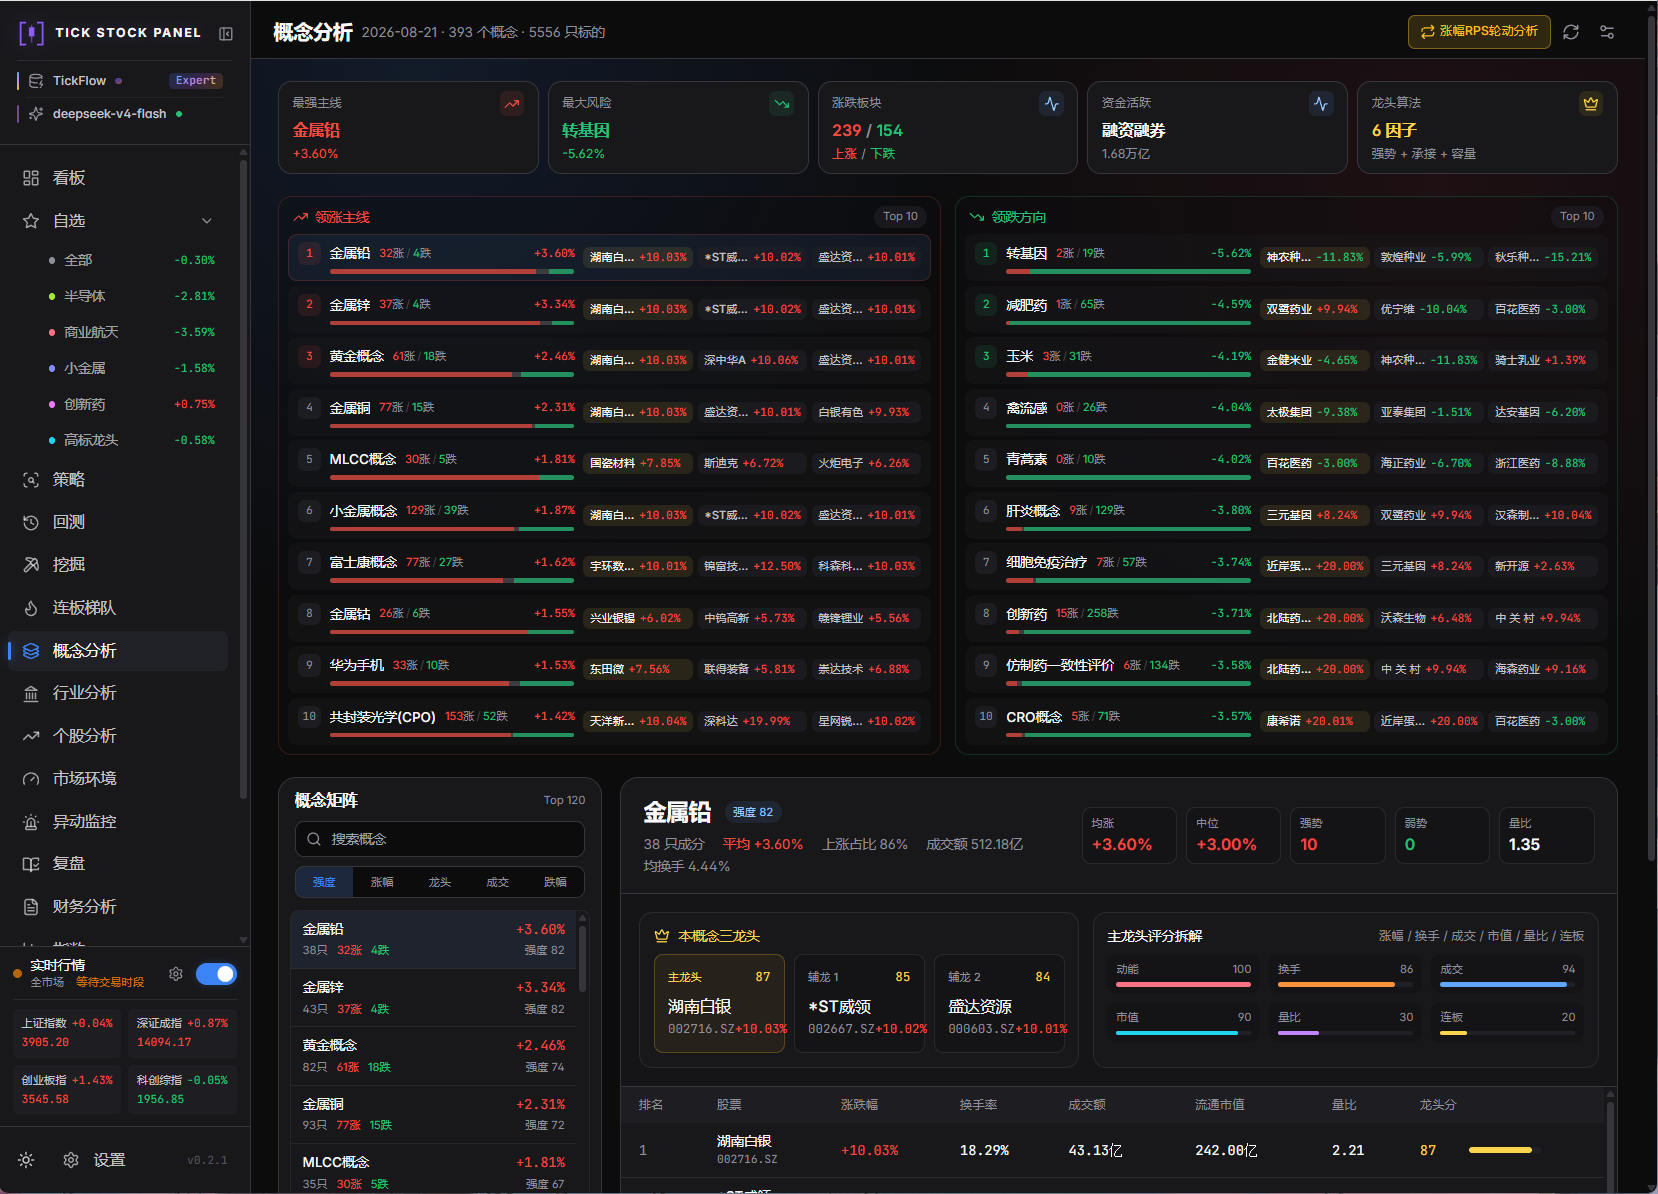
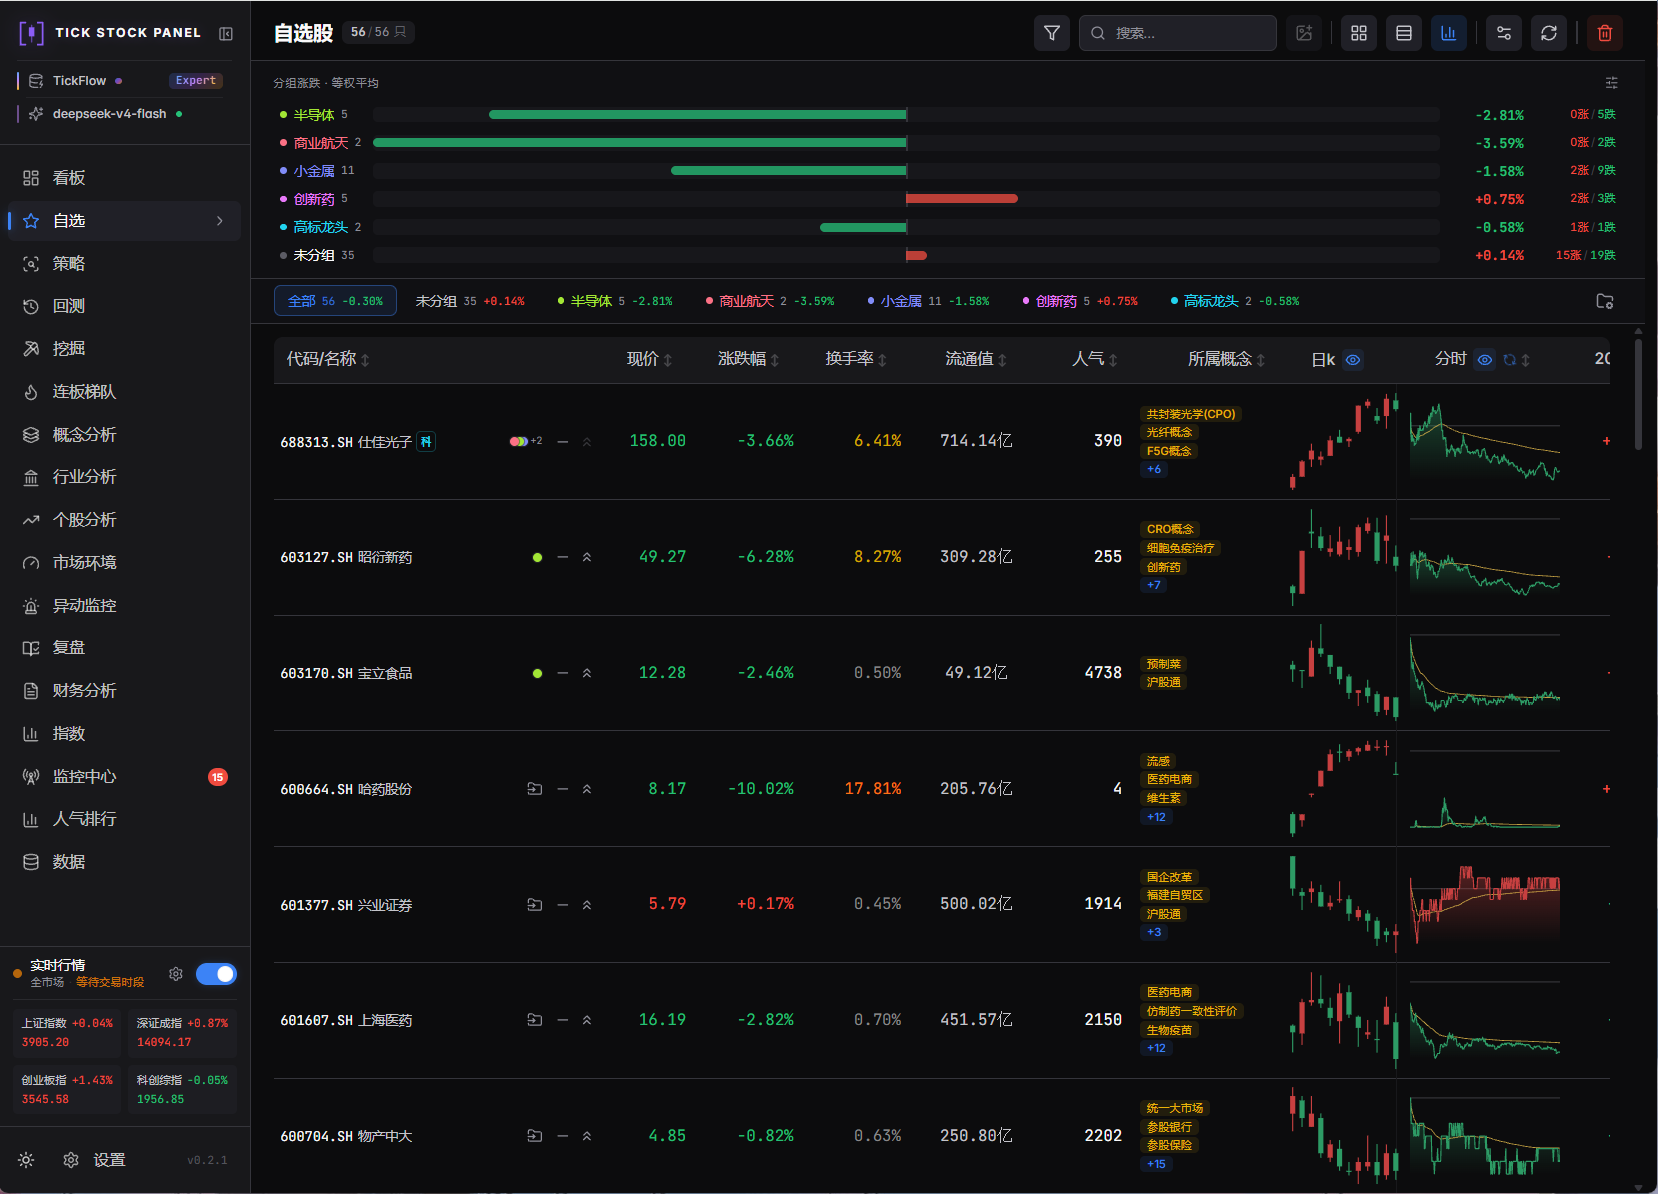
| Sector Analysis | Watchlists |
 |
 |
Real-time Monitoring and Anomalies
The dashboard includes a live monitoring module. You can set trigger rules based on price levels, indicators, or deviations from averages. When an event occurs, the panel sends a webhook, shows a browser notification, and even speaks the ticker aloud via the Web Speech API.
Integrating Language Models
The project added LLM integration via an OpenAI-compatible interface. You can connect Ollama, DeepSeek, or closed APIs. The models serve two practical roles: generating screener rule code from text descriptions and composing an evening report with sector movement analysis after market close.
How to Deploy and Run
The fastest way to launch the project is via Docker Compose:
cp .env.example .env
docker compose up --build
After building, the panel opens at http://localhost:3018.
For local development, you'll need Python 3.11+, Node.js 20, package managers uv and pnpm:
cp .env.example .env
./dev.sh
The script will check the environment, install backend dependencies via uv and frontend via pnpm, then start FastAPI on port 3018 and the Vite dev server on 3011.
Configuration is set up in the .env file:
TICKFLOW_API_KEY=              # Ключ источника данных TickFlow (можно оставить пустым для базового режима)
AI_API_KEY=                    # Ключ LLM-провайдера для генерации стратегий
PORT=3018                      # Порт приложения
Connecting Your Own Data Sources
The base project is configured for the Chinese TickFlow service SDK, however the developer made the data layer pluggable. The repository includes a Node.js plugin stock-sdk and examples of declarative source descriptions via YAML.
If you want to adapt the panel for MOEX, crypto exchanges, or Yahoo Finance, you just need to implement the daily bar provider interface and feed them in Parquet format. All the other mechanics—moving average calculations, backtesting engine, Lightweight Charts graphs, and alert system—will continue to work unchanged.
Is It Worth Trying
The tick-stock-panel project is interesting primarily for its architectural cleanliness. The author abandoned heavy relational databases in favor of Polars + DuckDB + Parquet, which makes the system fly on an ordinary laptop.
If you trade on the Chinese market, the project can be used as a ready-made working tool out of the box. If your interest lies in other exchanges, the repository codebase will serve as an excellent template for building your own analytics terminal.
Related projects