Turning OpenStreetMap Data into Posters with prettymaps
Sometimes you come across libraries that are simply a joy to look at. They don't solve complex enterprise problems or speed up builds tenfold — instead, they take geodata and turn it into graphics you want to print out and hang on your wall in a frame.
About three years ago, vector circular city maps with soft pastel colors went viral on Reddit and Hacker News. It turned out that this aesthetic was created by a small script from Brazilian developer Marcelo Prats. The project is called prettymaps.
Under the Hood
The library is built on a simple stack of tools. It fetches raw geographic features from OpenStreetMap using osmnx, processes polygon geometry with shapely, and renders the final composition through familiar matplotlib. For preparing vector outlines for plotters, the author also used vsketch.
Instead of manually exporting layers, filtering road, river, and building tags, configuring projections, and wrestling with matplotlib axis styles, you just pass an address or coordinates and get a ready-made drawing.
A quick start looks literally like this:
import prettymaps

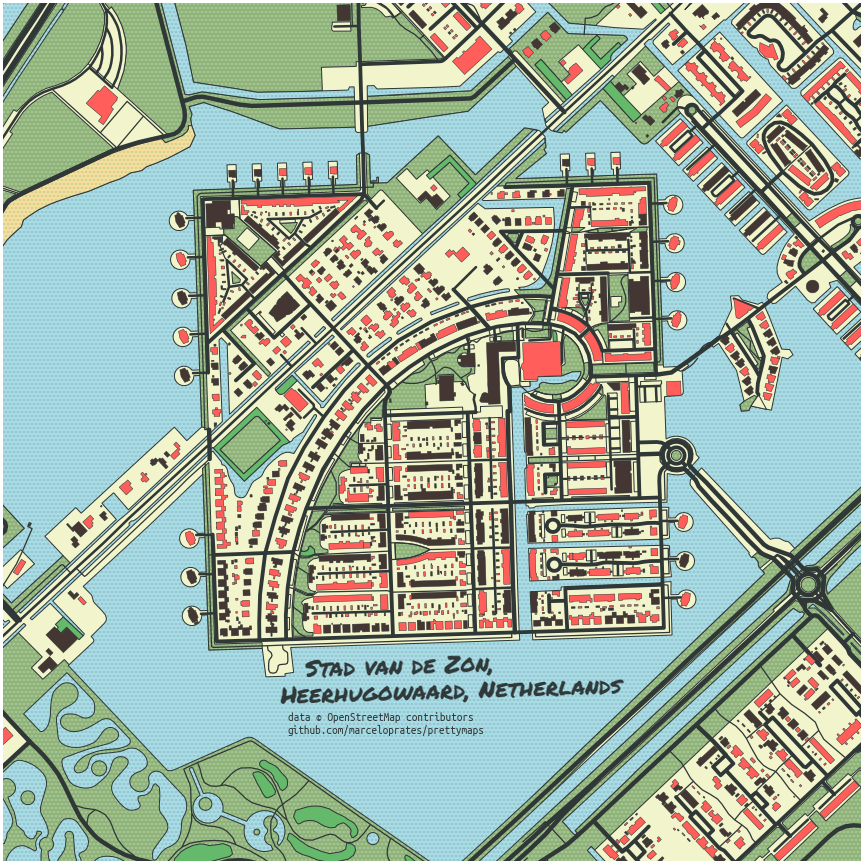
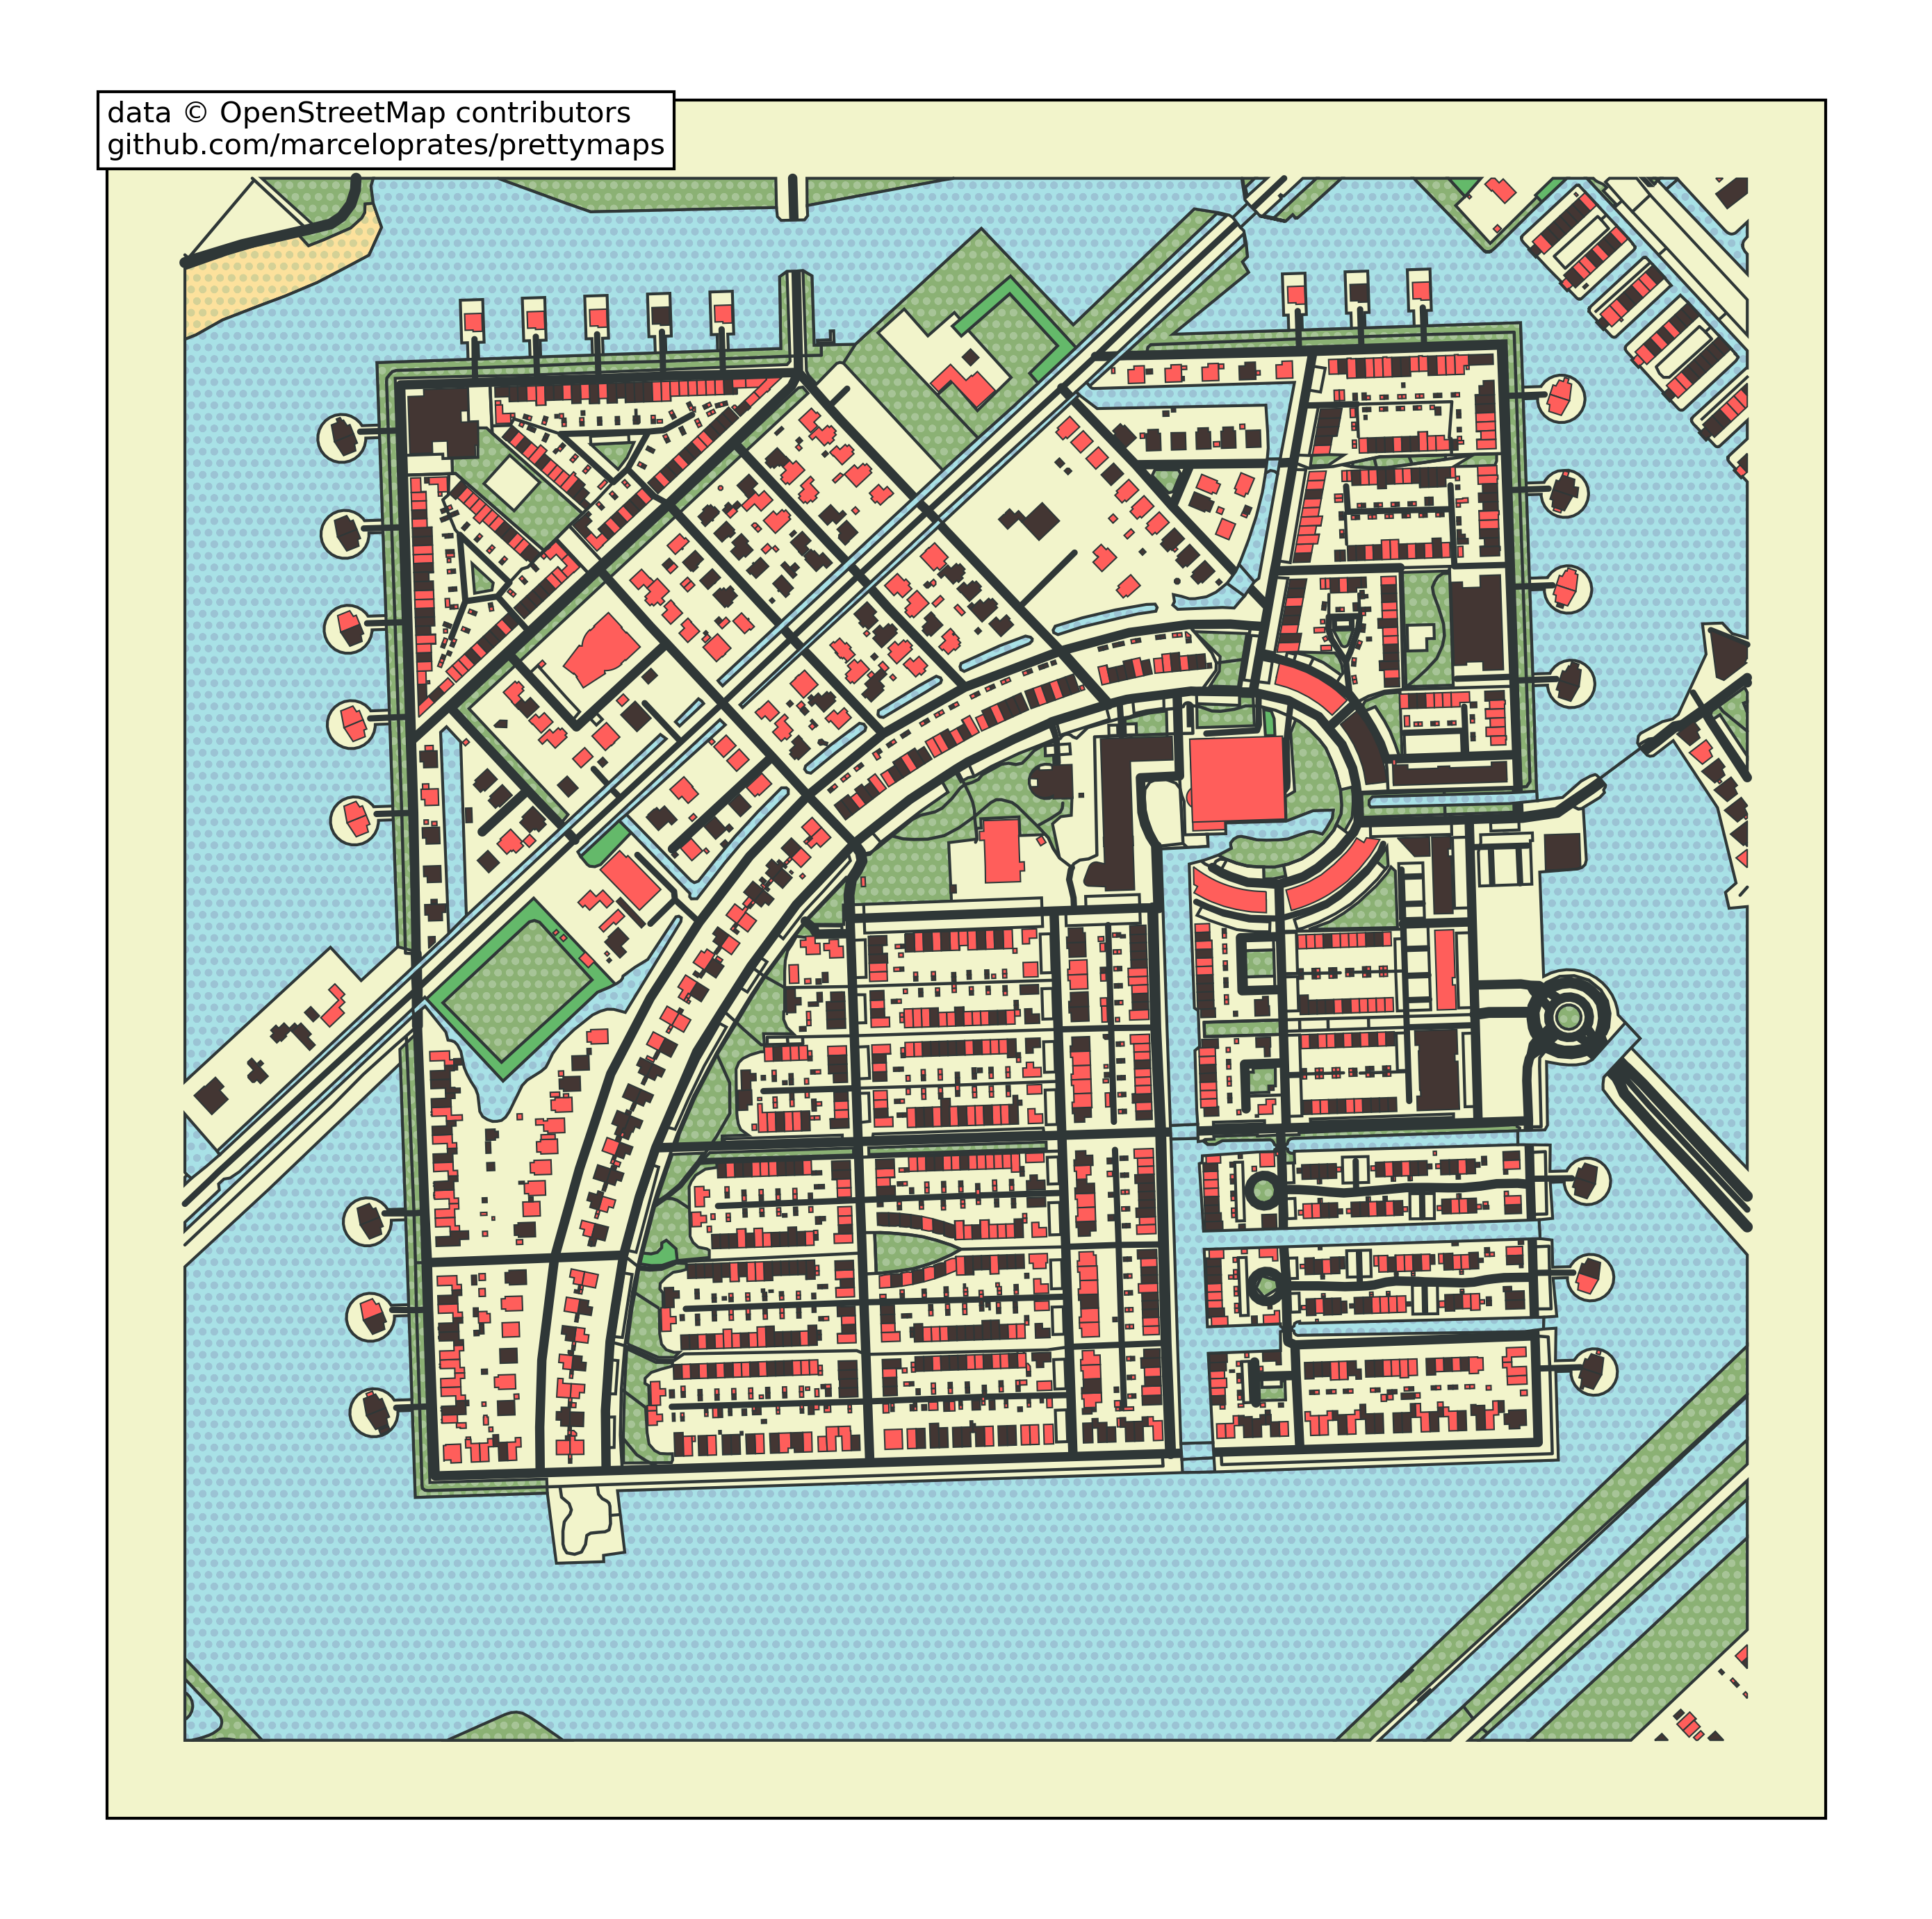
plot = prettymaps.plot('Stad van de Zon, Heerhugowaard, Netherlands')
One function call downloads the data for the desired area, slices it into layers, and builds the plot.
How to Customize Your Map
The library's full flexibility is revealed in the fine-tuning options of the prettymaps.plot() function.
Here are the parameters you'll work with most often:
- layers defines a dictionary of OpenStreetMap layers. Here you set the tags used to select objects: water bodies (
natural: water), buildings (building: True), parks, streets of different categories, or railway tracks. - style sets rendering rules for each layer. This accepts familiar matplotlib parameters: fill color (
fc), stroke color (ec), line width (lw), and ready-made color palettes (palette). - circle, radius, and dilate control the canvas boundaries. You can crop the map into a perfect circle of a given radius in meters or leave a rectangular area.
- preset loads ready-made style configurations (for example,
default,minimal,macao, ortijuca) so you don't have to build a color scheme from scratch.
An example of configuring a specific location:
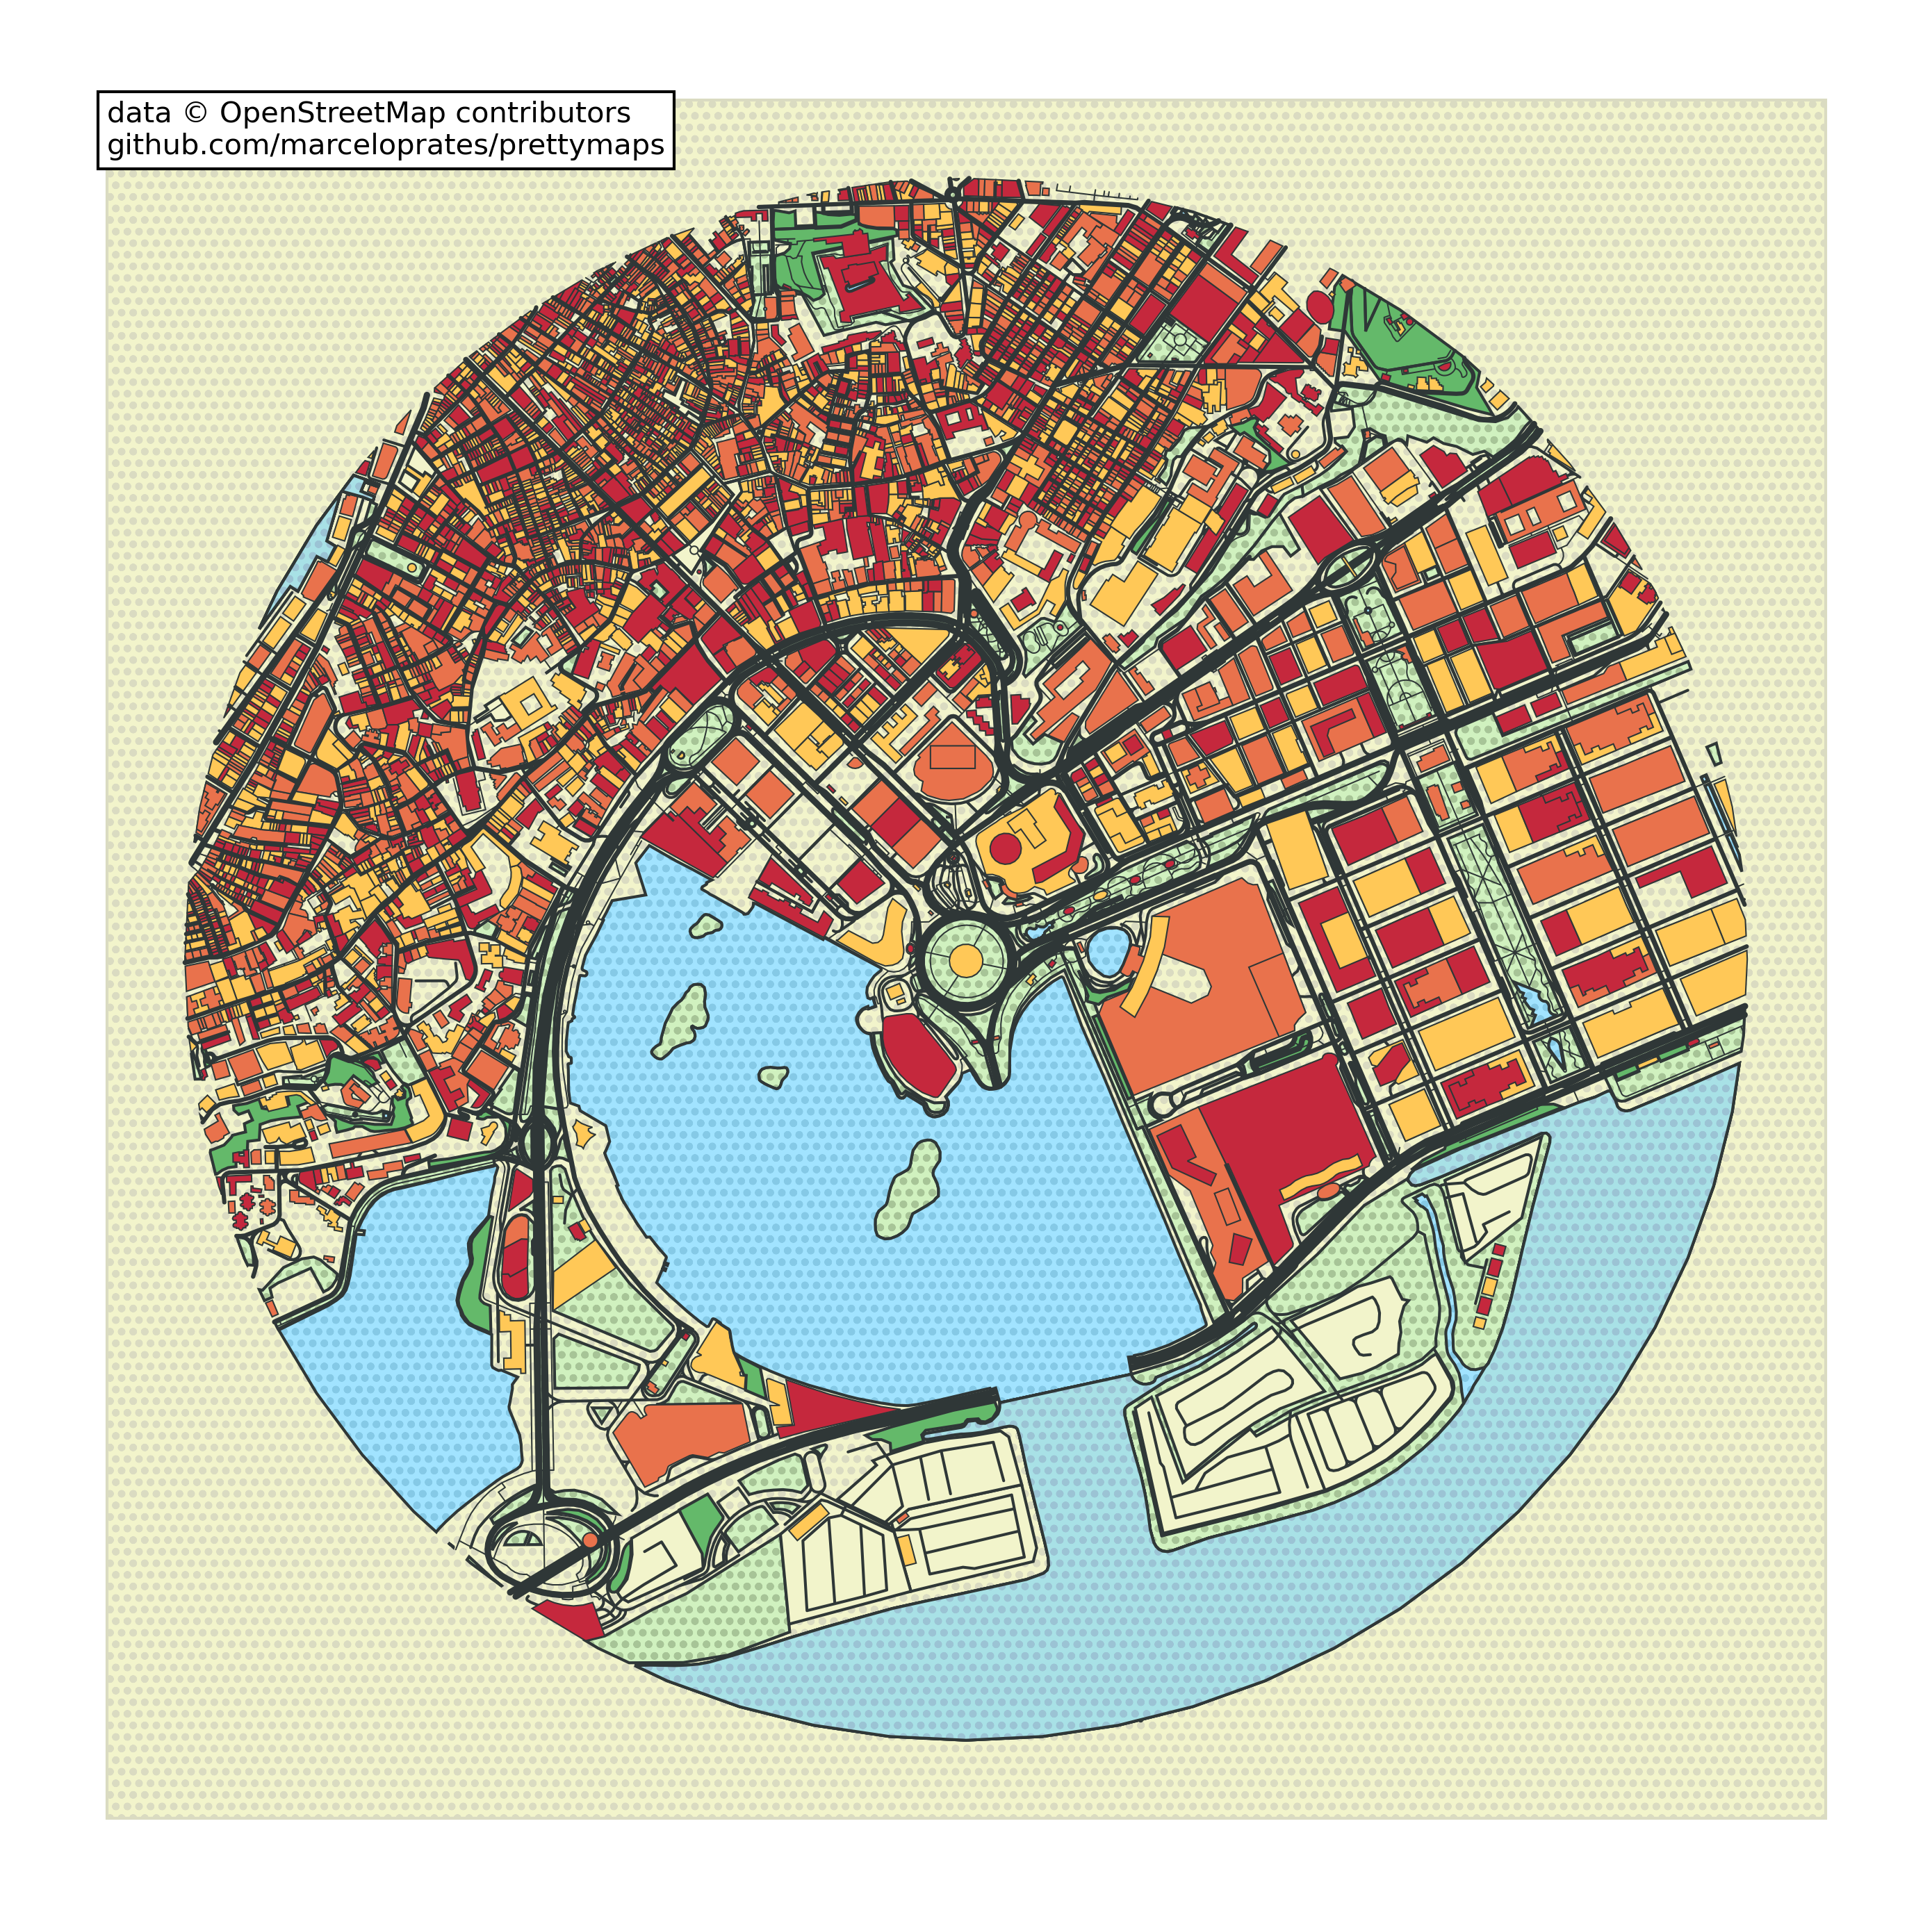
plot = prettymaps.plot(
    'Praça Ferreira do Amaral, Macau',
    circle=True,
    radius=1100,
    layers={
        "water": {"tags": {"natural": ["water", "bay"]}},
        "building": {"tags": {"building": True}},
    },
    style={
        "water": {"fc": "#a1e3ff", "ec": "#2F3737"},
        "building": {"palette": ["#FFC857", "#E9724C", "#C5283D"]},
    },
)
The function returns a Plot dataclass object. Inside you'll find geodataframes for each layer (geodataframes), as well as references to matplotlib fig and ax objects. This is handy if you want to add your own annotations, markers, or labels using standard Python plotting methods.
How to Run Without Writing Code
If you're too lazy to write code or want to quickly click through palettes for different cities, the repository includes a ready-made web interface built with streamlit.
Installing the package:
pip install prettymaps
Launching the interface:
streamlit run app.py
For interactive experiments, the author prepared a notebook for marimo (a modern replacement for Jupyter). You can open it locally with the command marimo edit notebooks/tutorial.py or run it directly in Google Colab via the link in the documentation.
Practical Use Cases
The first application that comes to mind is generative art and merch. Maps of hometown cities, neighborhoods, or memorable places in a minimalist style work great for posters, postcards, and t-shirts. Since the library supports exporting vector outlines, you can send the graphics to pen plotters and engravers.
The second scenario is report and presentation design. If you're doing an urban study, analyzing transit accessibility, or building a real estate dashboard, standard map tiles often look overloaded. Here you can keep only the outlines of city blocks and water bodies, coloring them strictly in your brand's colors.
License and Important Notes
The project has a couple of things worth knowing before you adopt it.
The code is distributed under the GNU AGPL v3.0 license. This carries obligations: if you use the library on a backend of a network service, you'll need to open-source that service.
When exporting images, you must preserve attribution to OpenStreetMap and the repository itself — this is a direct requirement of the geodata license. The repository author also принципиально opposes using their generator for selling NFTs and specifically highlights this in the README.
Is It Worth Trying
The library does its job excellently. If you've ever needed to create a beautiful city map without manual work in Illustrator or QGIS, prettymaps will save you several hours of work.
To get started, just install the package via pip and run through a few examples from Colab. The project works with Python 3.11+, reliably fetches data via the OSM API, and produces predictable results.
Related projects