How to link news to stock charts and understand market movement drivers
Anyone who has ever opened a trading terminal has seen this. A stock suddenly drops 8% in a single session, the chart draws a scary red candle, and the financial news feed is flooded with dozens of scattered articles. To match a specific event with a price movement, you end up spending half a day manually searching by dates.
The author of the open-source project PokieTicker solved this problem for themselves and released the source code on GitHub. The result is a tool that overlays events directly onto candlestick charts, organizes news by topic, and runs them through a combination of language models and classical machine learning.
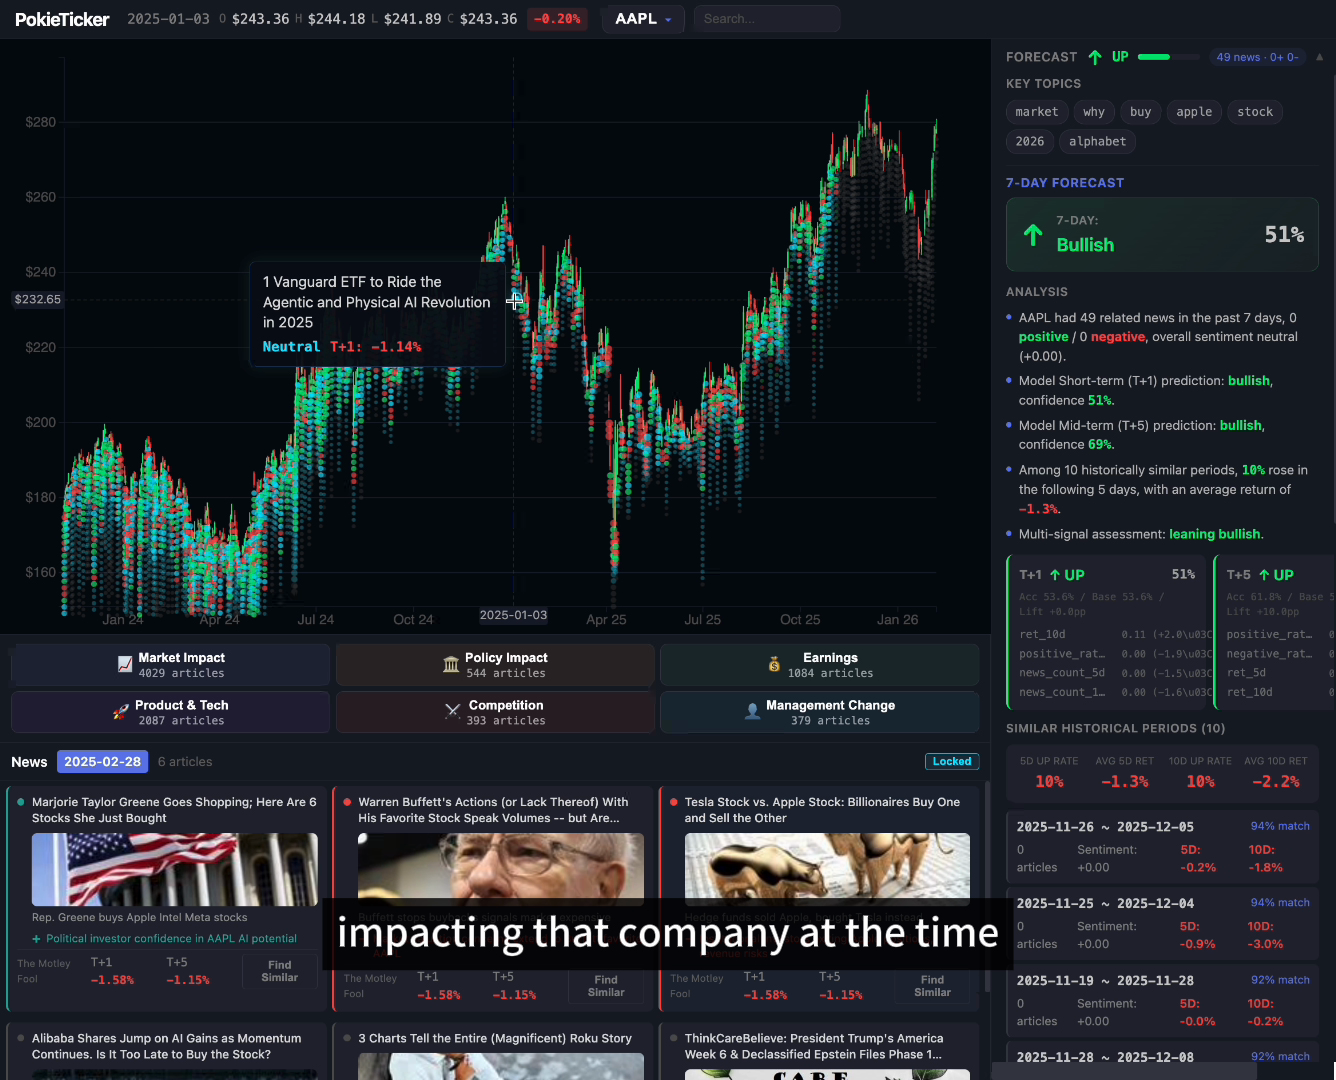
What the app can do
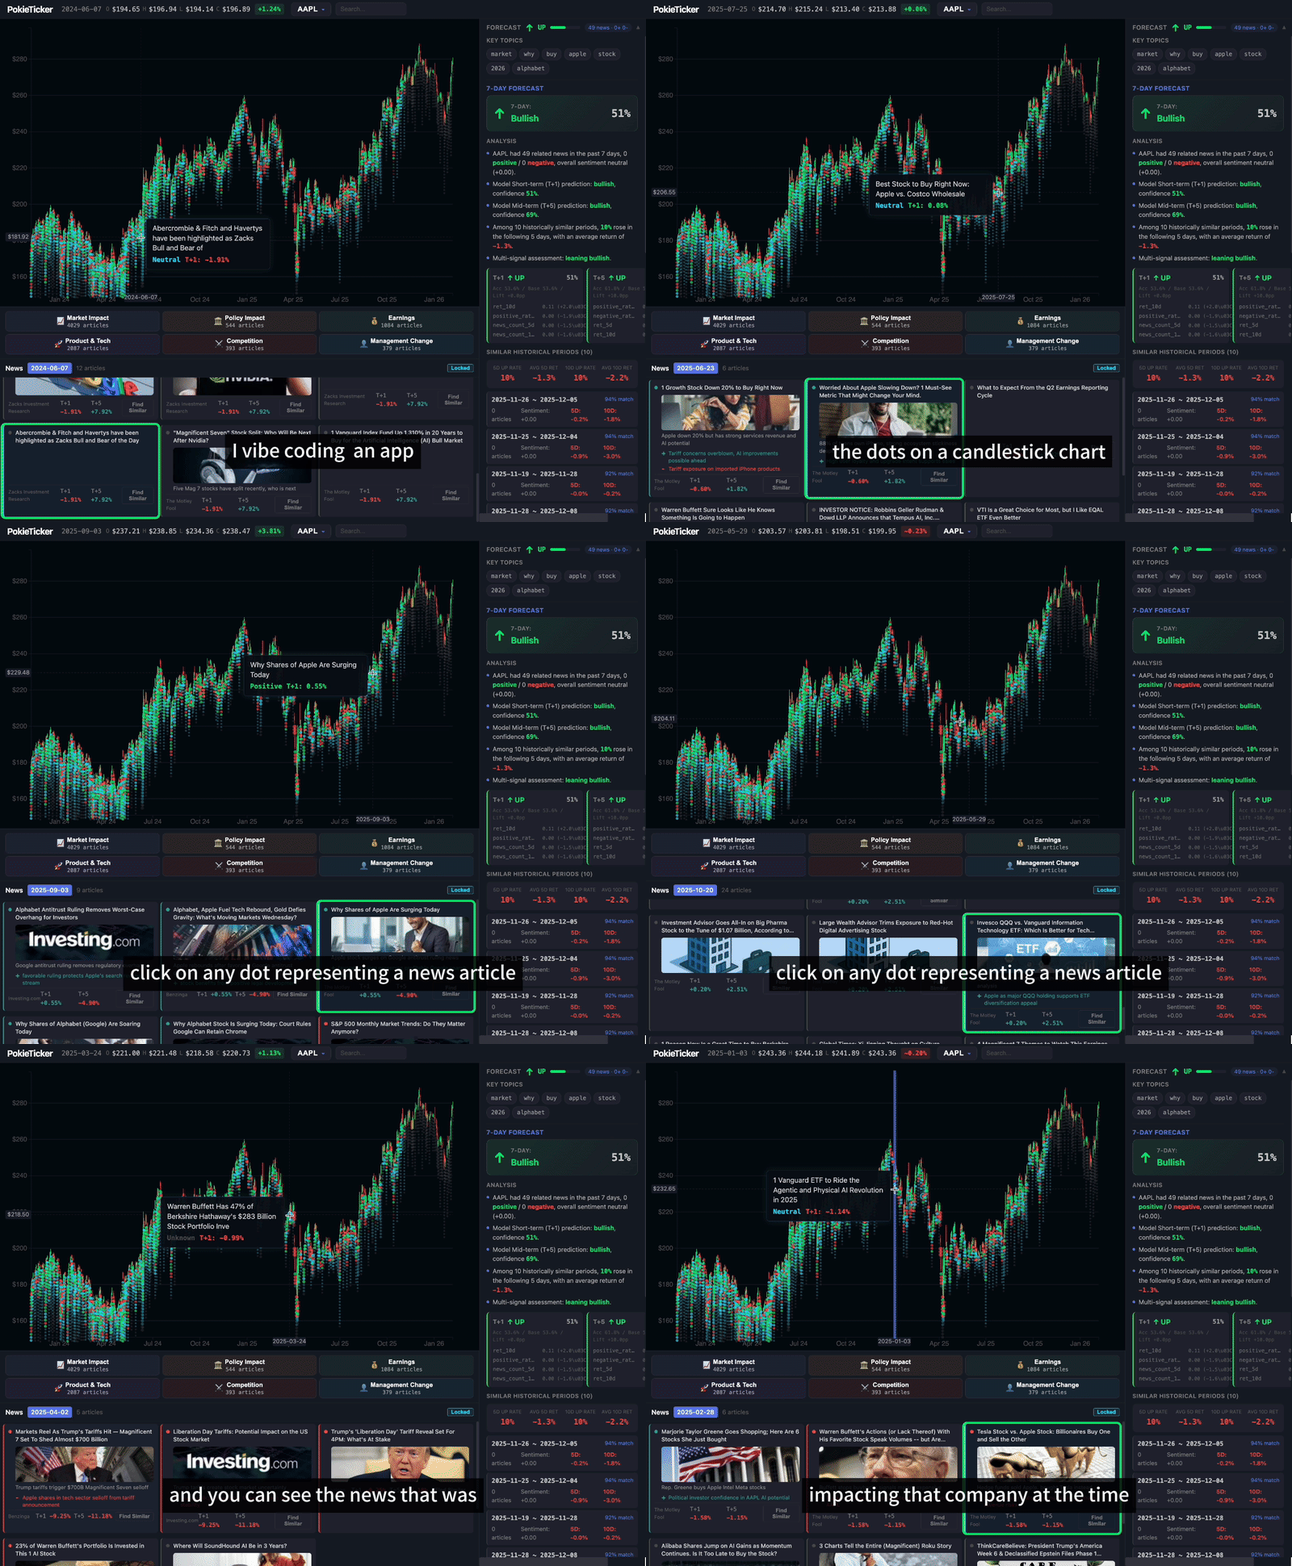
The interface is built around an interactive D3.js chart. Instead of a dry terminal, you see a timeline where each day with news is marked with a dot. Clicking a dot opens a context panel with details.
The main things worth checking out:
- Interactive event marking on candlestick charts. You can immediately see which day a quarterly report or regulatory news came out and how the price reacted.
- Thematic filtering. News is broken down by category: earnings, products, regulatory actions, management changes, and general market conditions.
- Historical analogy search. The system compares the current news background with past periods using cosine similarity of vector embeddings and shows where the stock moved in similar situations.
- Movement explanation via LLM. You select a date range with your mouse, and the model gathers the facts and produces a brief summary of why the dip or surge happened.
Architecture and cost-efficient data pipeline
Working with financial text often hits you with neural network API bills. If you feed every publication directly to Claude, your balance will be wiped out in a couple of hours. The author built a three-layer filtering pipeline that cuts unnecessary costs.
First, data is fetched from the Polygon API. Then Layer 0 kicks in—a simple set of Python rules that filters out spam, clickbait, and useless roundups like "5 stocks to buy in May." This step eliminates about 17% of informational noise for free.
The remaining articles go to Layer 1. Here, Claude Haiku is used via the Batch API in batches of 50. The model determines sentiment, extracts bullish or bearish arguments, and formulates the gist of the discussion. Batch processing costs just 35 cents per 1,000 articles.
Finally, Layer 2 based on Claude Sonnet activates only on direct user request, when a deep dive into a specific price spike for a selected time period is needed.
How price movement prediction works
On top of news sentiment and technical indicators, an XGBoost-based model is at work. The author isn't trying to build a "trading grail" and honestly warns in the description that the project is research-oriented.
The feature vector consists of 31 parameters:
- News metrics: article count per day, average sentiment score, ratio of positive to negative, moving averages of sentiment over 3, 5, and 10 days, plus sentiment momentum.
- Technical signals: returns over 1, 3, 5, and 10 trading days, volatility measure, trading volume anomalies, RSI-14 indicator, and moving average crossovers.
XGBoost classifiers are trained to predict the direction of price movements at horizons T+1, T+3, and T+5. The logic is straightforward: strong news triggers market inertia that often lasts one to three days, especially if negative publications come out in series.
The backend also includes an experimental LSTM module, although gradient boosting remains the primary working solution.
Frontend (React + Vite + D3.js)          Backend (FastAPI + SQLite WAL)
+---------------------------------+      +----------------------------+
|  CandlestickChart (D3.js)       |----->|  /api/stocks/{sym}/ohlc    |
|  NewsPanel & Predictions        |<-----|  /api/news, /api/predict   |
+---------------------------------+      +----------------------------+
Quick start without API key registration
A nice touch: to try the project locally, you don't need to immediately buy Polygon subscriptions or register an account with Anthropic. The repository already includes a ready-made archive with a SQLite database containing 51,000 candles and 61,000 news articles, plus trained model weights.
Deployment takes five minutes:
git clone https://github.com/owengetinfo-design/PokieTicker.git
cd PokieTicker

# Распаковываем готовую базу и модели
gunzip -k pokieticker.db.gz
tar xzf models.tar.gz -C backend/ml/

# Настраиваем бэкенд на Python 3.10+
python -m venv venv
source venv/bin/activate
pip install -r requirements.txt

# Устанавливаем зависимости фронтенда
cd frontend && npm install && cd ..
Services are started in two terminal tabs. In the first one, we bring up FastAPI:
source venv/bin/activate
uvicorn backend.api.main:app --reload
In the second, we launch Vite:
cd frontend && npm run dev
After that, the interface opens in the browser at http://localhost:7777/PokieTicker/.
If you want to pull fresh data from the exchange, just copy .env.example to .env, add your free Polygon key and Anthropic key, then run the python -m backend.weekly_update command.
Impressions and conclusions
PokieTicker is interesting not so much as a trading advisor, but as an example of a well-designed full-stack application. There's plenty to learn from it:
- A clean FastAPI and SQLite setup in WAL mode, which is more than sufficient for hundreds of thousands of records.
- Efficient LLM usage through preliminary rule-based filtering and Batch API.
- Financial data visualization in pure D3.js without heavy third-party widgets.
- Practical combination of NLP metrics with classical time series analysis.
The repository will be useful for developers building their own analytical dashboards, experimenting with text processing for ML, or simply wanting to understand the causes of market fluctuations. The source code is released under the permissive MIT license.
Related projects