Dissecting HTTP Requests Right in the Terminal with httptap
When an external service or internal microservice suddenly starts lagging, your hands naturally reach for good old curl. But standard curl just outputs the response body, and to extract connection phase timings, you have to build a monstrous template with a dozen variables via the -w flag. Or you fire up a browser, open the Network tab in DevTools, and admire the pretty waterfall there. On a remote server's console, you can't open a browser, and digging through raw output is a pain.
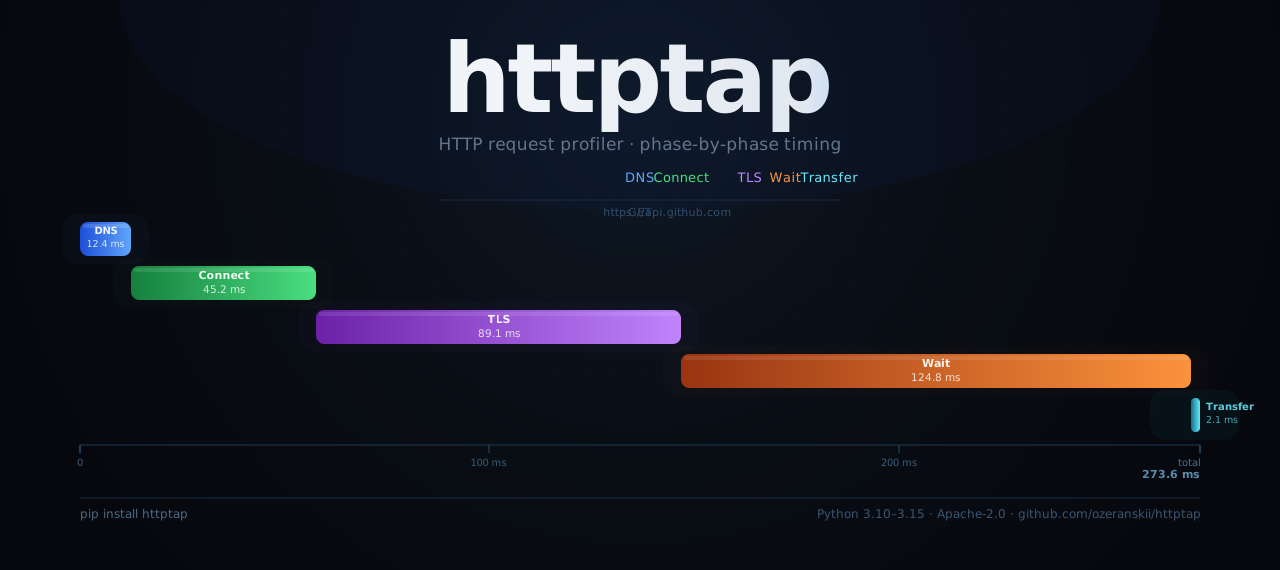
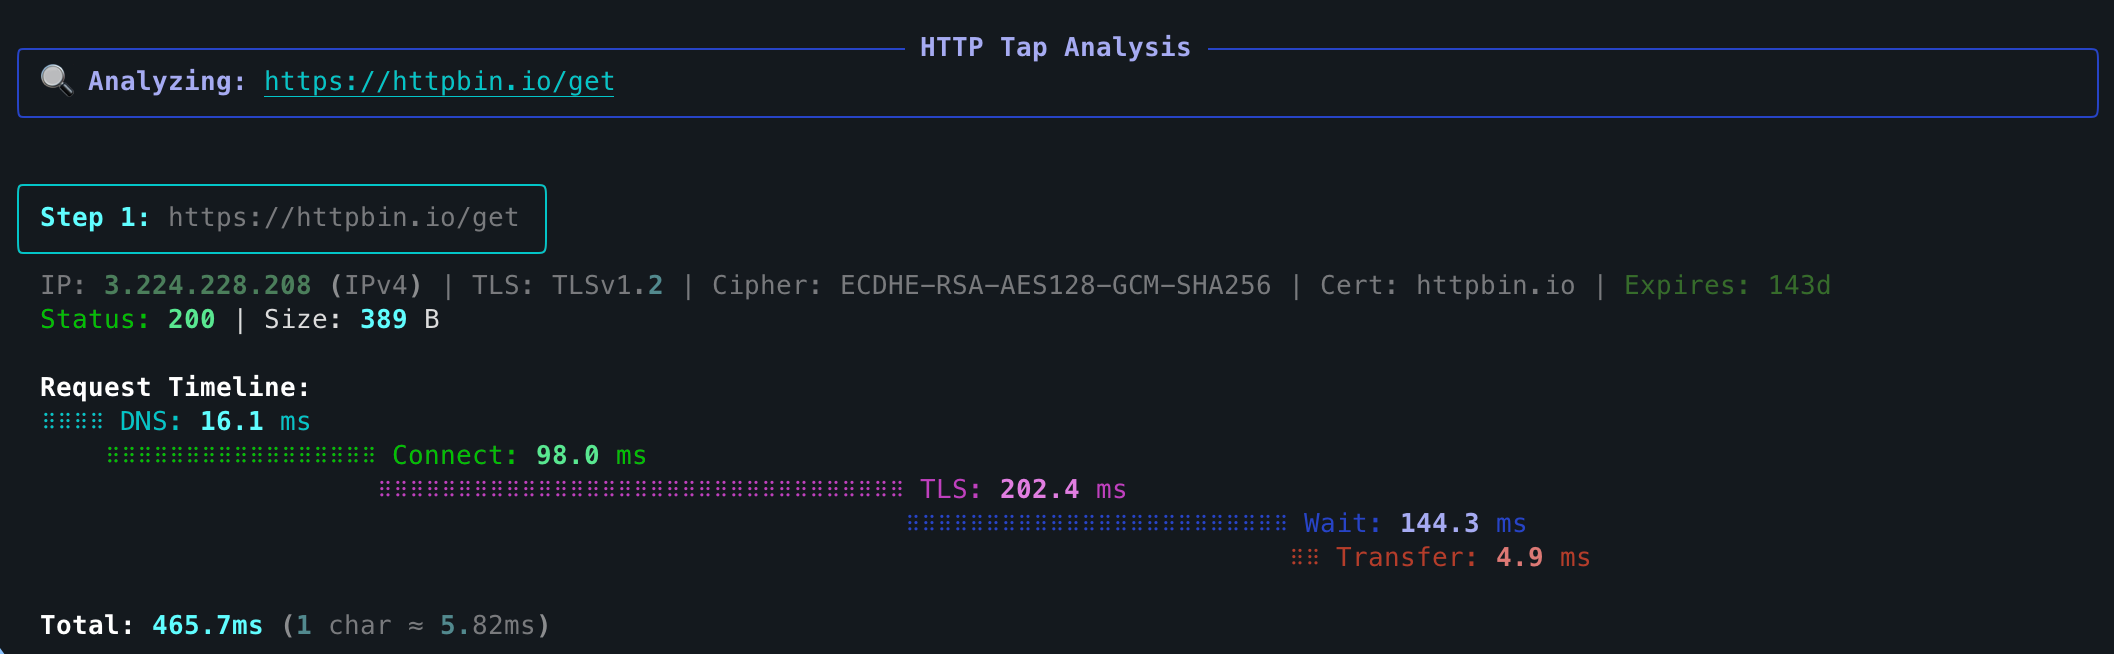
I recently stumbled upon httptap. It's a neat Python tool that breaks down any HTTP request into its component phases: DNS, TCP handshake, TLS negotiation, time to first byte (TTFB), and response body transfer. All of this is displayed as a clear waterfall chart right in the console.
What's Under the Hood and Why You Need It
The tool is built in Python using httpx, httpcore, dnspython, and the Rich library for rendering the interface. It doesn't just measure total response time—it hooks into network stack tracing and shows exactly which stage a request got stuck on.
If you've ever used the httpstat project, the idea will feel familiar. But httptap has several key differences:
- It can track redirect chains and measure each step's timing separately, showing a summary table.
- Supports latency budget (SLO) checks with human-readable exit codes.
- Inspects TLS certificates: reports hostname (CN), cipher algorithm, protocol version, and days until expiration.
- Exports detailed structured JSON with all metrics for automation.
- Understands curl flags (
-X,-L,-H,-k,-x), so you don't have to retrain your fingers.
How to Install and Run
The fastest way to install on macOS or Linux is via Homebrew:
brew install httptap
If you prefer Python tools, pip or uv will work:
uv pip install httptap
# или
pip install httptap
There's also a ready-made Docker image in the GitHub Packages registry:
docker run --rm ghcr.io/ozeranskii/httptap:latest https://example.com
Basic usage is straightforward:
httptap https://httpbin.io/get
The tool will make the request and output a neat table with timings for each step, status code, and network info (including HTTP/2 protocol version and IPv4/IPv6 address family).
What the Tool Can Do in Practice
Working with Any HTTP Methods and Request Bodies
The tool sends JSON or XML without issues. If you pass the --data flag without explicitly specifying a method, the tool will switch to POST on its own, mimicking curl's behavior:
httptap https://httpbin.io/post --data '{"status": "testing", "source": "httptap"}'
If the data is in a file, you can pass the path via the @ syntax:
httptap https://httpbin.io/post --data @payload.json
For other methods, there's the familiar --method flag (or -X):
httptap https://httpbin.io/put --method PUT --data '{"key": "value"}'
Tracking Redirect Chains
Few tools can properly show how much time a series of 301 and 302 responses takes. Here you just need to add the --follow flag (or -L):
httptap --follow https://httpbin.io/redirect/2
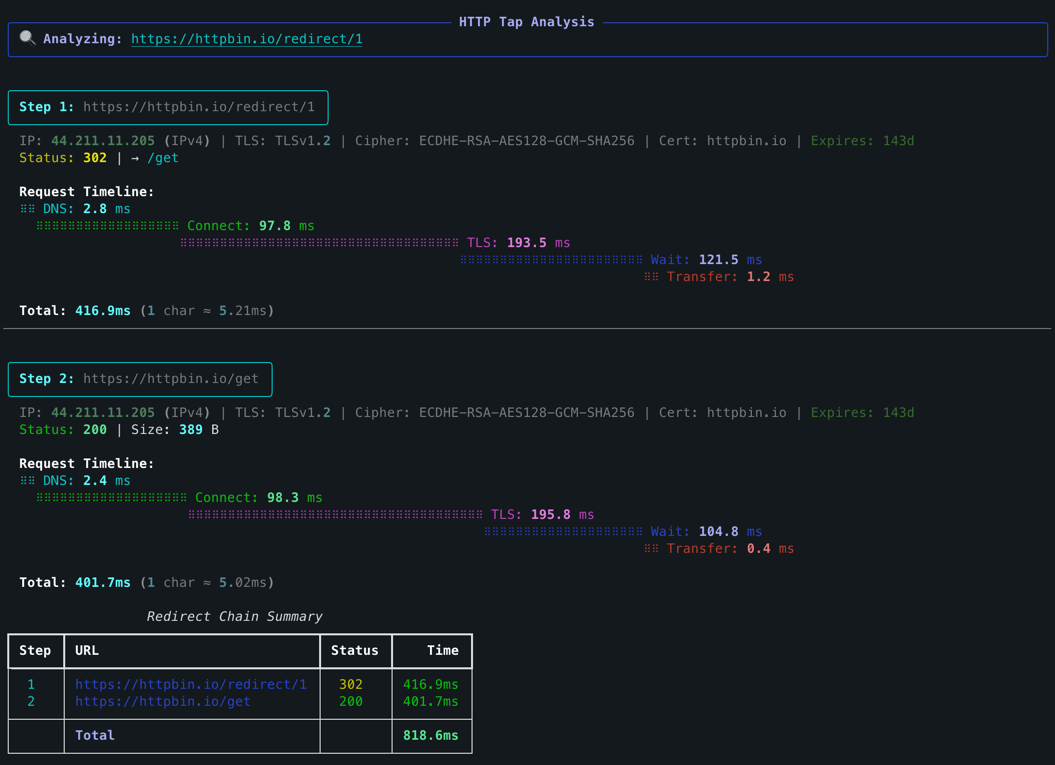
The output will include a detailed breakdown for each intermediate host and a final row with the total time.
Checking Latency Budgets in CI
One of the most useful features of the project is the --slo flag. It turns the tool into a smoke test and gate instrument for build pipelines:
httptap --slo total=500,ttfb=200 https://api.example.com/health
If the target service responds with a 200 status but TTFB exceeds 200 milliseconds or the total time goes over 500 milliseconds, the tool will return exit code 4. If a network error occurs, it returns code 75 (EX_TEMPFAIL per BSD sysexits standard).
Thanks to the code separation, you can configure a deployment script to distinguish between network failures and performance degradation:
httptap --slo total=1500,tls=200 https://staging.example.com/
case $? in
  0) echo "Сервис уложился в нормативы" ;;
  4) echo "Нарушен SLO по времени ответа"; exit 1 ;;
  75) echo "Временный сетевой сбой, повторяем проверку" ;;
esac
Scripting and Compact Output
For automation and cron jobs, Rich's graphical output may be excessive. Two modes are available for such scenarios:
-
Compact line mode
--compactfor logs:httptap --compact https://httpbin.io/get -
Metrics text stream
--metrics-only:httptap --metrics-only https://httpbin.io/getYou'll get a single line back like:
Step 1: dns=30.1 connect=97.3 tls=199.0 ttfb=472.2 total=476.0 status=200 bytes=389 ip=44.211.11.205 family=IPv4 tls_version=TLSv1.2 proxy=direct -
JSON export via
--json out/report.json, where timings, headers, TLS parameters, and IP addresses are saved.
Custom Resolvers and Extensibility
If you're writing internal Python utilities, httptap can be used as a library. The architecture is built on protocols (typing.Protocol), so components are easy to swap out. For example, you can override the DNS resolver to test a specific IP's response without modifying /etc/hosts:
from httptap import HTTPTapAnalyzer, SystemDNSResolver


class StaticDNS(SystemDNSResolver):
    def resolve(self, host, port, timeout):
        return "93.184.216.34", "IPv4", 0.05


analyzer = HTTPTapAnalyzer(dns_resolver=StaticDNS())
steps = analyzer.analyze_url("https://example.com")
for step in steps:
    print(f"TTFB: {step.timing.ttfb_ms:.2f} ms")
The tool turned out compact, fast, and focused on one specific task. It nicely bridges the gap between raw curl -w and heavy graphical profilers.
The utility will be useful for operations engineers for quick diagnosis of slow endpoints on servers, backend developers for measuring external API latencies, and QA teams for checking SLOs right in pipelines. Try installing it locally and replacing your usual curl -I for a couple of days. The difference in clarity is noticeable immediately.
Related projects