How to Stop Torturing Xcode and Start Living with DebugSwift
Sound familiar: you're testing an app on a physical device away from your desk, and suddenly — a bug. Or a network request returns 500, but you can't see the error body. You have to go back to your computer, plug in the cable, launch Xcode, and try to reproduce the issue. And if it's an intermittent bug? In moments like these, you wish you had a developer console right in your pocket.
Today we'll break down DebugSwift — a powerful toolkit that turns your iOS app into a full-fledged debugging lab. It's not just "another logger," but a comprehensive tool that gives you access to network requests, view hierarchy, and even the database right inside the running app.
What DebugSwift Is and Why You Need It
DebugSwift is an open-source library for Swift developers that embeds a hidden debug menu into your app. Think Chrome DevTools, but for iOS. The project took the best ideas from tools like CocoaDebug and DBDebugToolkit, but with a focus on modern Swift 6 and native Apple Silicon support.
The main highlight here is autonomy. You can give a build to a tester or client, and if something goes wrong, they can check the logs, inspect network traffic, or even take a screenshot of the screen hierarchy on their own without your help.
Five Reasons to Add DebugSwift to Your Project
1. Network Inspector on Steroids
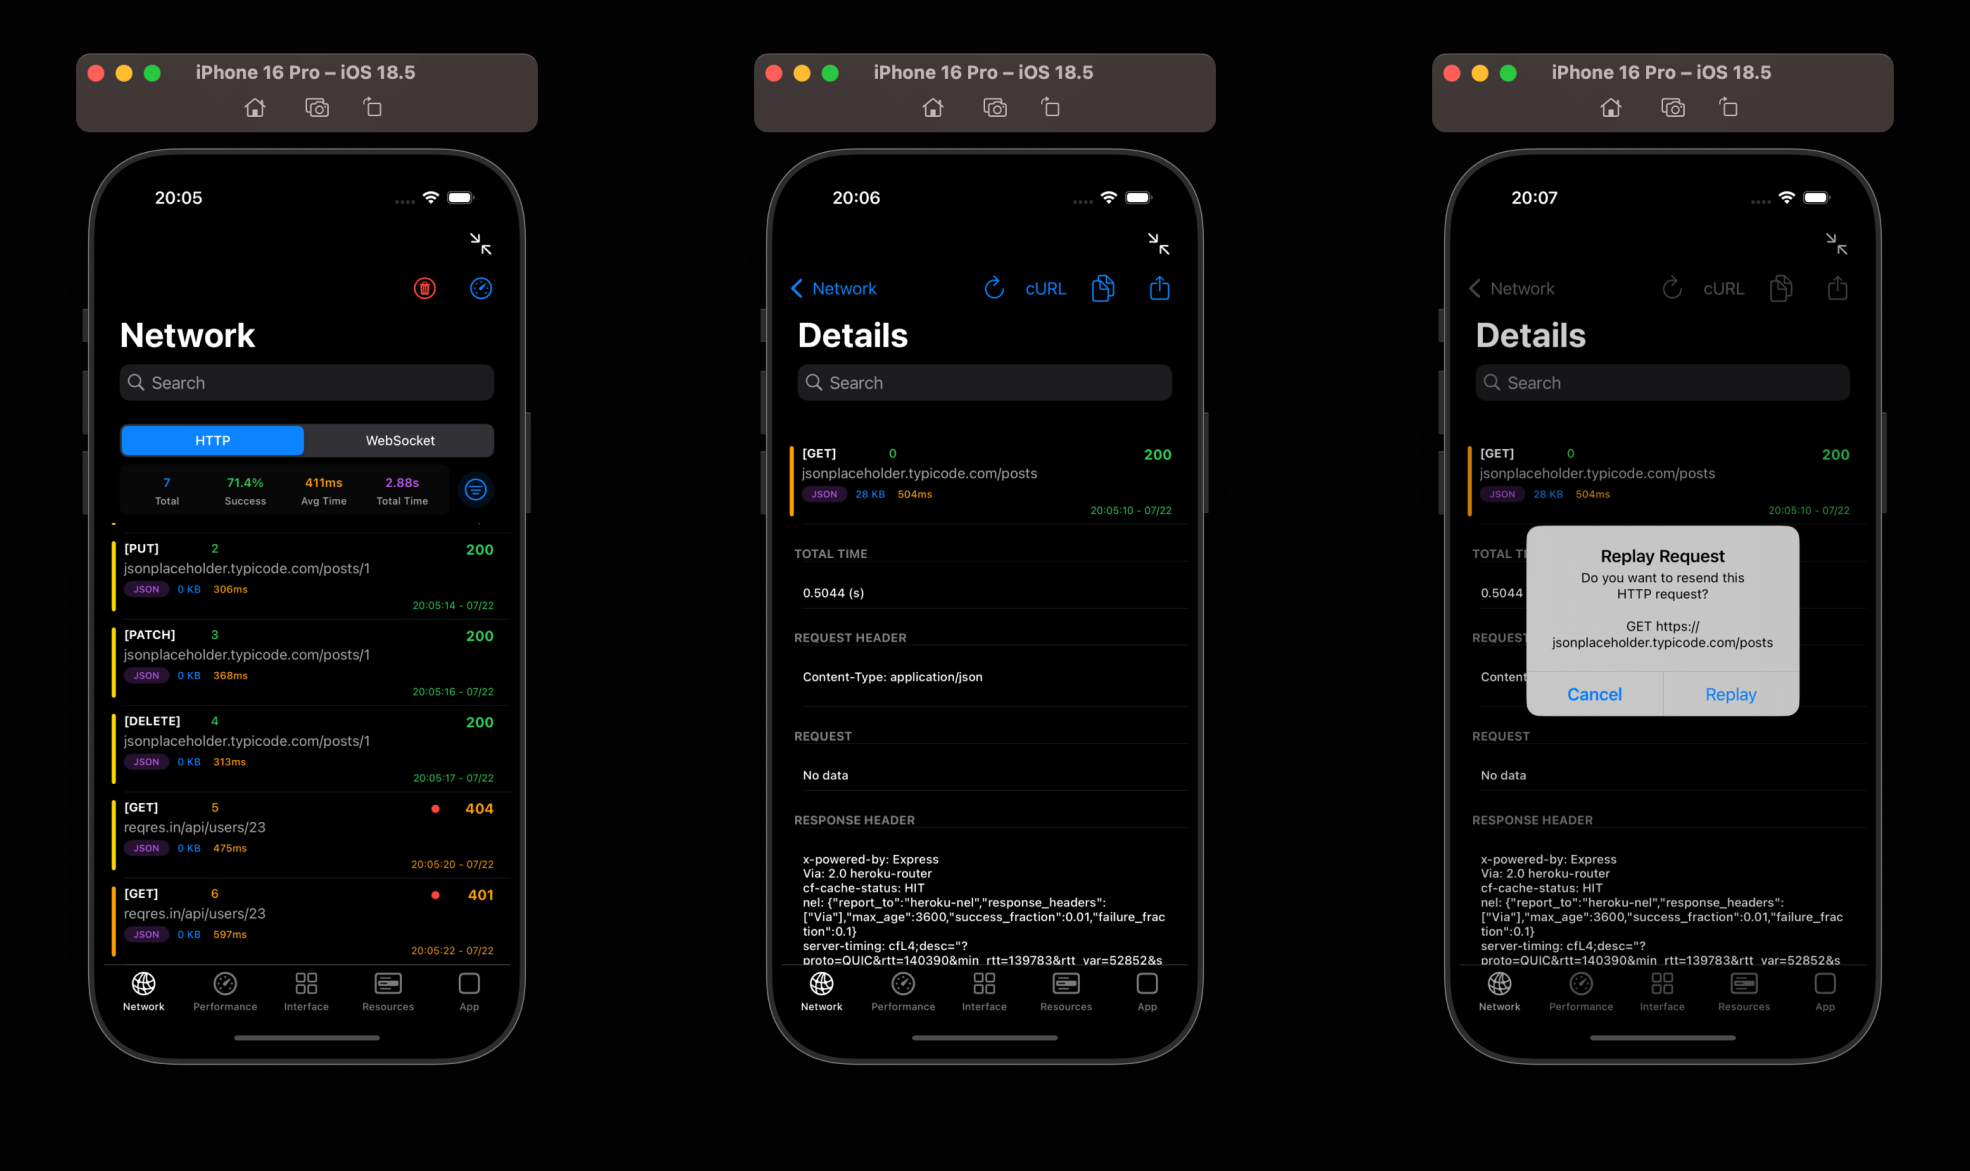
Traffic monitoring is the foundation. DebugSwift intercepts all HTTP requests and responses, beautifully formats JSON, and highlights syntax. But there are also "killer features":
- WebSocket Inspector: Automatically tracks frames without extra configuration.
- On-the-fly Decryption: If your backend delivers encrypted data (AES-256/128), you can register a key in DebugSwift, and the inspector will show you the clean text.
- Filtering: You can hide analytics requests so they don't clutter the log.
2. Visual Interface Audit
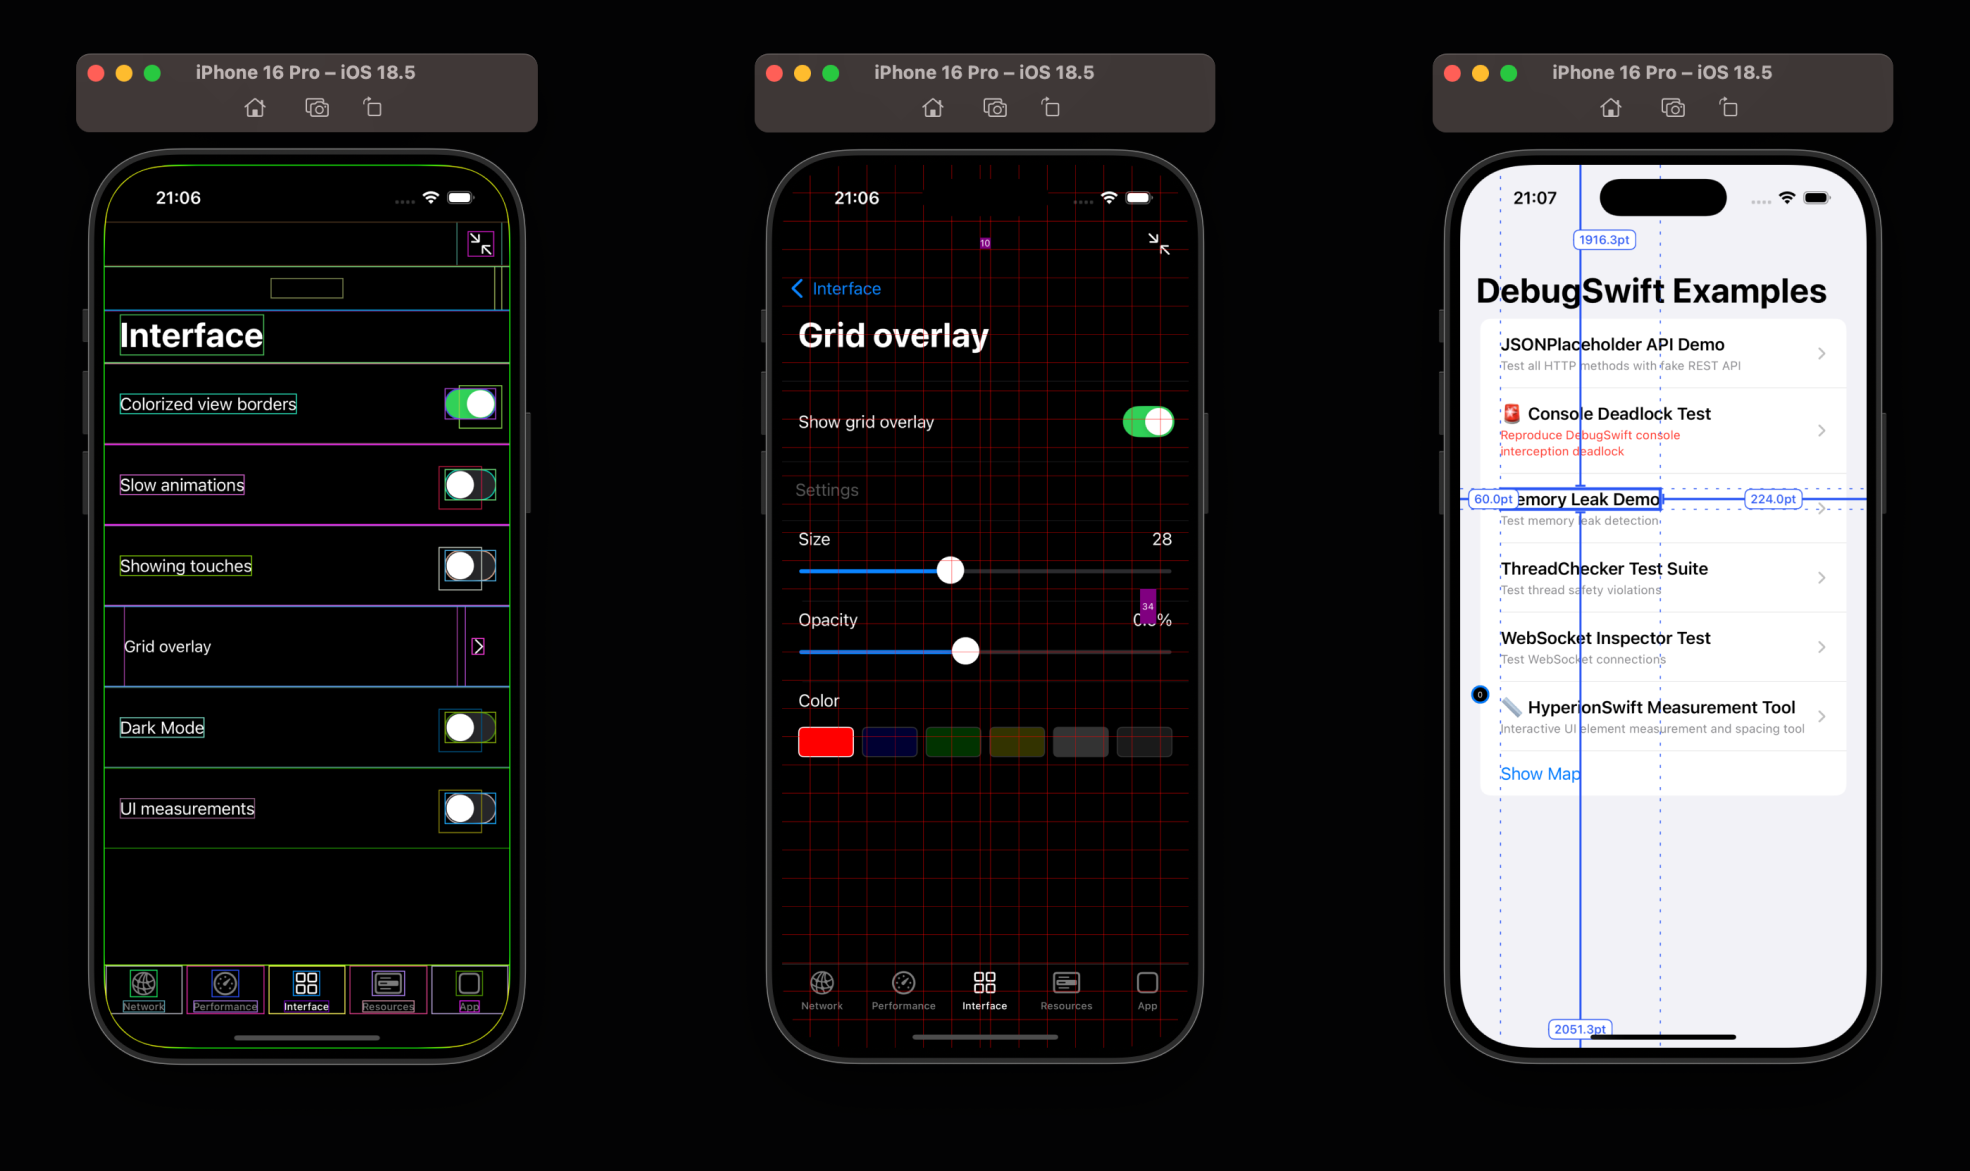
Sometimes you need to understand why a view shifted by a couple of pixels. DebugSwift has a built-in 3D hierarchy inspector (similar to the one in Xcode, but working right in the app).
- Grid Overlay: Overlays a grid for checking alignment.
- Slow Animations: Slows down animations to examine each transition frame.
- SwiftUI Render Tracking: An experimental feature that highlights re-rendering SwiftUI components. This is invaluable for performance optimization.
3. Hunting Memory Leaks
A forgotten strong reference in a closure — a classic. DebugSwift monitors ViewControllers and Views in real time. If an object should have been removed from memory but stayed there, the tool raises an alarm. There's also a performance widget that shows FPS, CPU load, and memory usage overlaid on your interface.
4. Access to App Internals
No more need to write print(UserDefaults.standard.dictionaryRepresentation()).
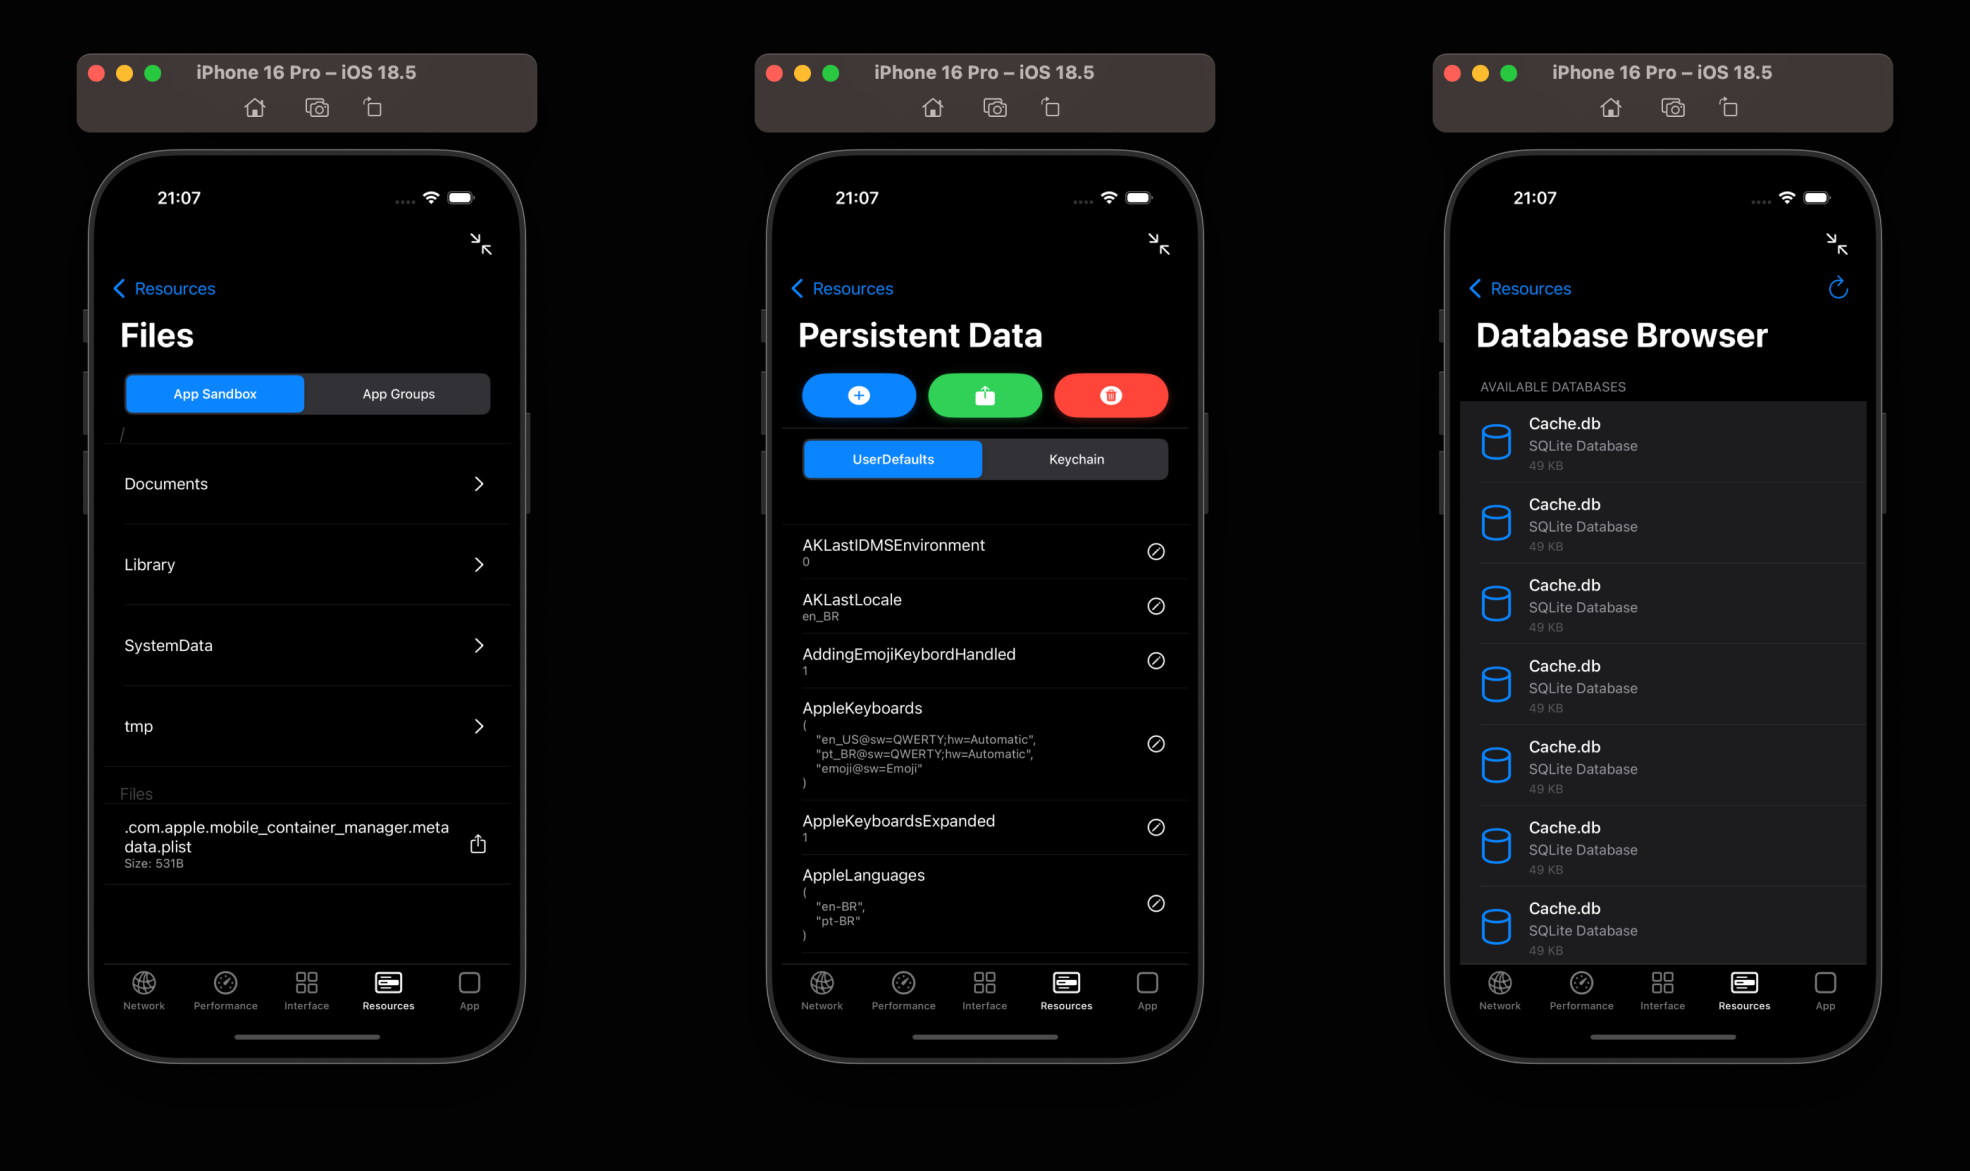
In the Resources section, you can:
- View and edit
UserDefaultsandKeychain. - Browse files in Sandbox and App Groups.
- Inspect SQLite and Realm databases.
- Copy APNS token with one button (how much time have we saved on this!).
5. Custom Actions
This is my favorite part. You can add your own buttons to the debug menu. For example: "Clear Cache," "Switch Server to Dev/Stage," or "Fill Cart with Test Products."
DebugSwift.App.shared.customAction = {
    [
        .init(title: "Инструменты разработки", actions: [
            .init(title: "Сбросить состояние") {
                // Ваша логика сброса
            }
        ])
    ]
}
How It Works Under the Hood
The project is written in Swift and requires iOS 14+. Interestingly, the developers paid a lot of attention to Apple Silicon support. If you've ever struggled with architecture errors in the Xcode simulator on M1/M2 chips, you can forget about that here — the library ships as a proper XCFramework.
For intercepting network traffic, it uses URLSession logging. If you create session configurations in advance, DebugSwift offers convenient methods for injecting your own protocol:
let config = URLSessionConfiguration.default
DebugSwift.Network.shared.injectIntoConfiguration(config)
let session = URLSession(configuration: config)
Practical Use Cases
Case #1: Remote Testing. You send a TestFlight build to a tester. They find a bug in the discount logic. Instead of asking for logs through the Mac console, the tester simply shakes the phone (Shake to Toggle), opens DebugSwift, goes to the network log, and sends you a screenshot of the JSON response from the server.
Case #2: Push Debugging. You need to test how the app handles a specific push notification payload. DebugSwift has a push simulator: you just paste the JSON, and the app processes it as if it came from Apple.
How to Get Started
Installation is straightforward via Swift Package Manager or CocoaPods. In AppDelegate, it takes just a couple of lines:
import DebugSwift

@main
class AppDelegate: UIResponder, UIApplicationDelegate {
    private let debugSwift = DebugSwift()

    func application(_ application: UIApplication, didFinishLaunchingWithOptions ...) -> Bool {
        #if DEBUG
        debugSwift.setup()
        debugSwift.show()
        #endif
        return true
    }
}
Tip: Always wrap the call in #if DEBUG to ensure debug tools don't accidentally end up in the App Store.
Verdict: Is It Worth Trying?
If you're tired of endless print() and constant project rebuilds just to check a value in the database or request headers — definitely yes. DebugSwift saves hours of time, especially during active development and API integration.
The project is actively developed, the community is alive, and Swift 6 support suggests the tool will remain relevant for a long time.
Try the project here: https://github.com/DebugSwift/DebugSwift
What debugging tools do you use? Share in the comments!
Related projects