Interactive Geopolitical Events Map Built with Next.js and Valyu API
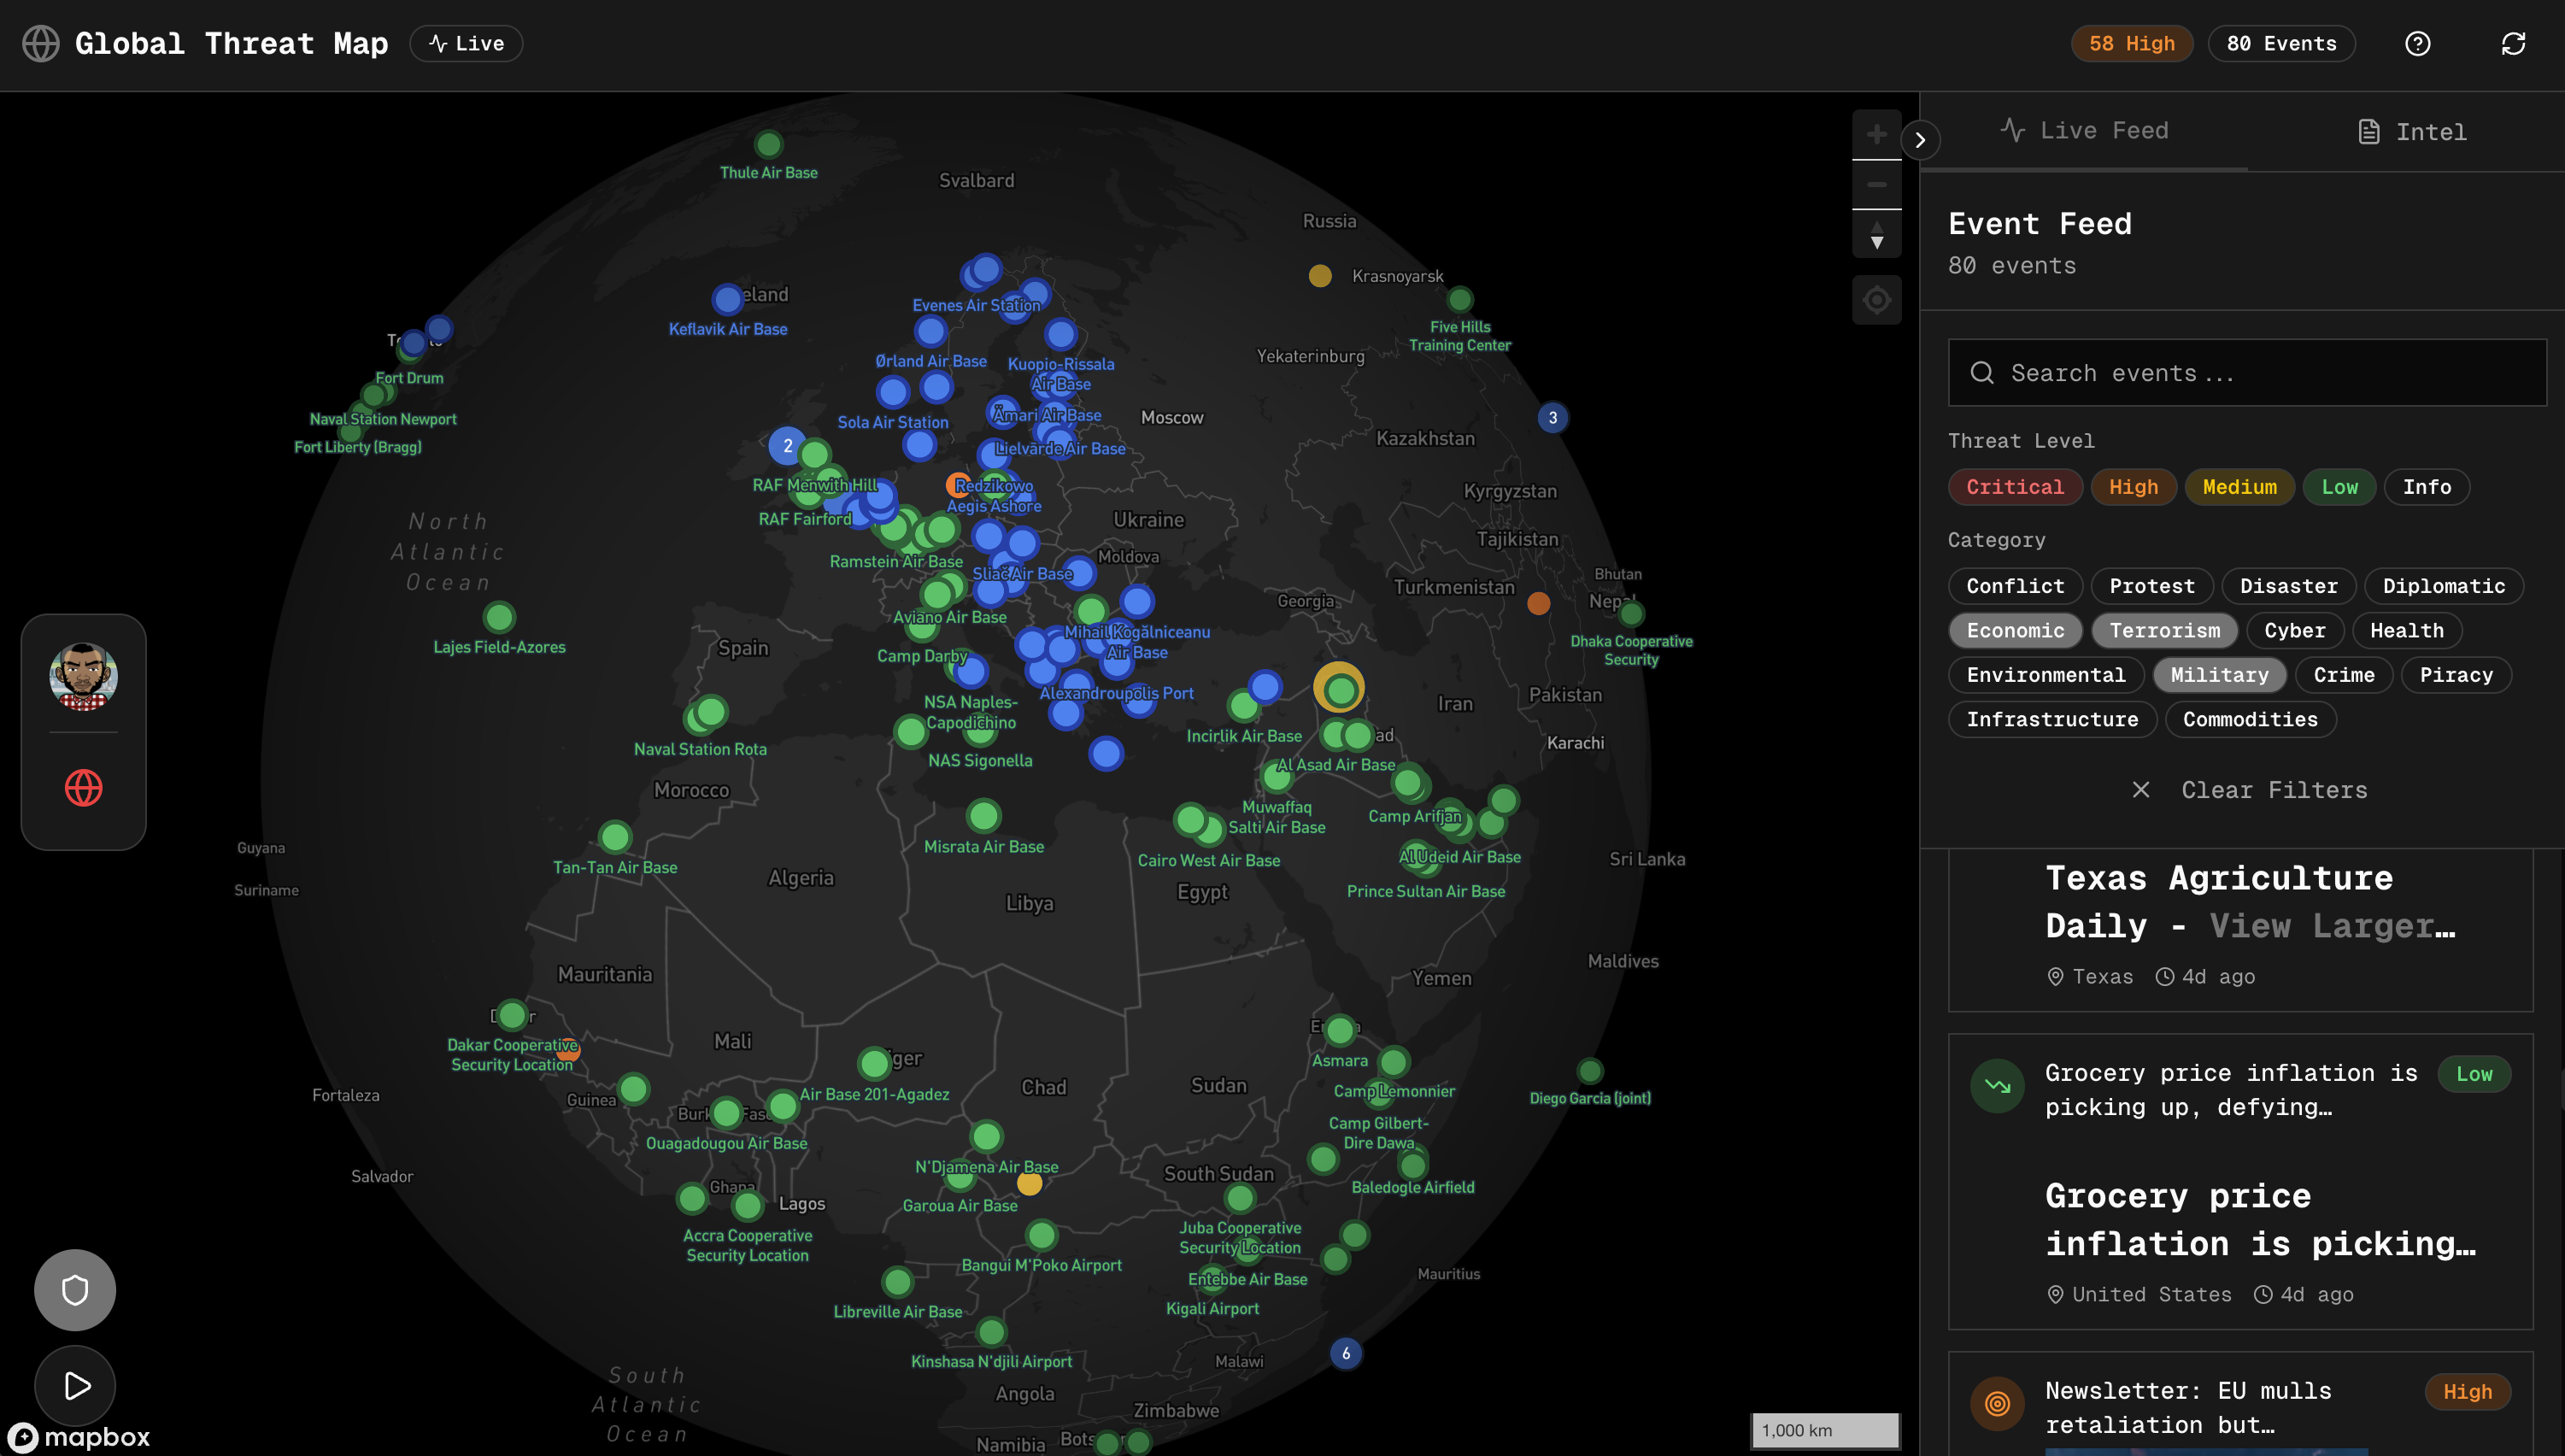
I recently came across an interesting project called globalthreatmap. The author built an interactive command center for monitoring geopolitics, military bases, and incidents worldwide in real time. If you've ever found yourself glued to conflict map dashboards or are interested in OSINT tools, this project will definitely catch your attention.
Why This Is Needed
Aggregating scattered news about international events into a unified picture has always been challenging. Typically, you'd need to monitor dozens of Telegram channels, news aggregators, and databases.
The repository author decided to visualize this flow on a dark Mapbox map. The result is a dashboard where geopolitical events are tied to coordinates, categorized, and supported by historical context for each country.
What the Project Can Do
The main screen greets you with an interactive map and an event feed. Let's break down how everything is structured within the interface:
- Interactive map with clustering. Incident points are grouped when you zoom out. There's a heatmap mode and automatic scrolling around the globe.
- Military bases layer. US bases (green markers) and NATO facilities (blue markers) are plotted on the map. Clicking opens a card with the facility name, type, and country of placement.
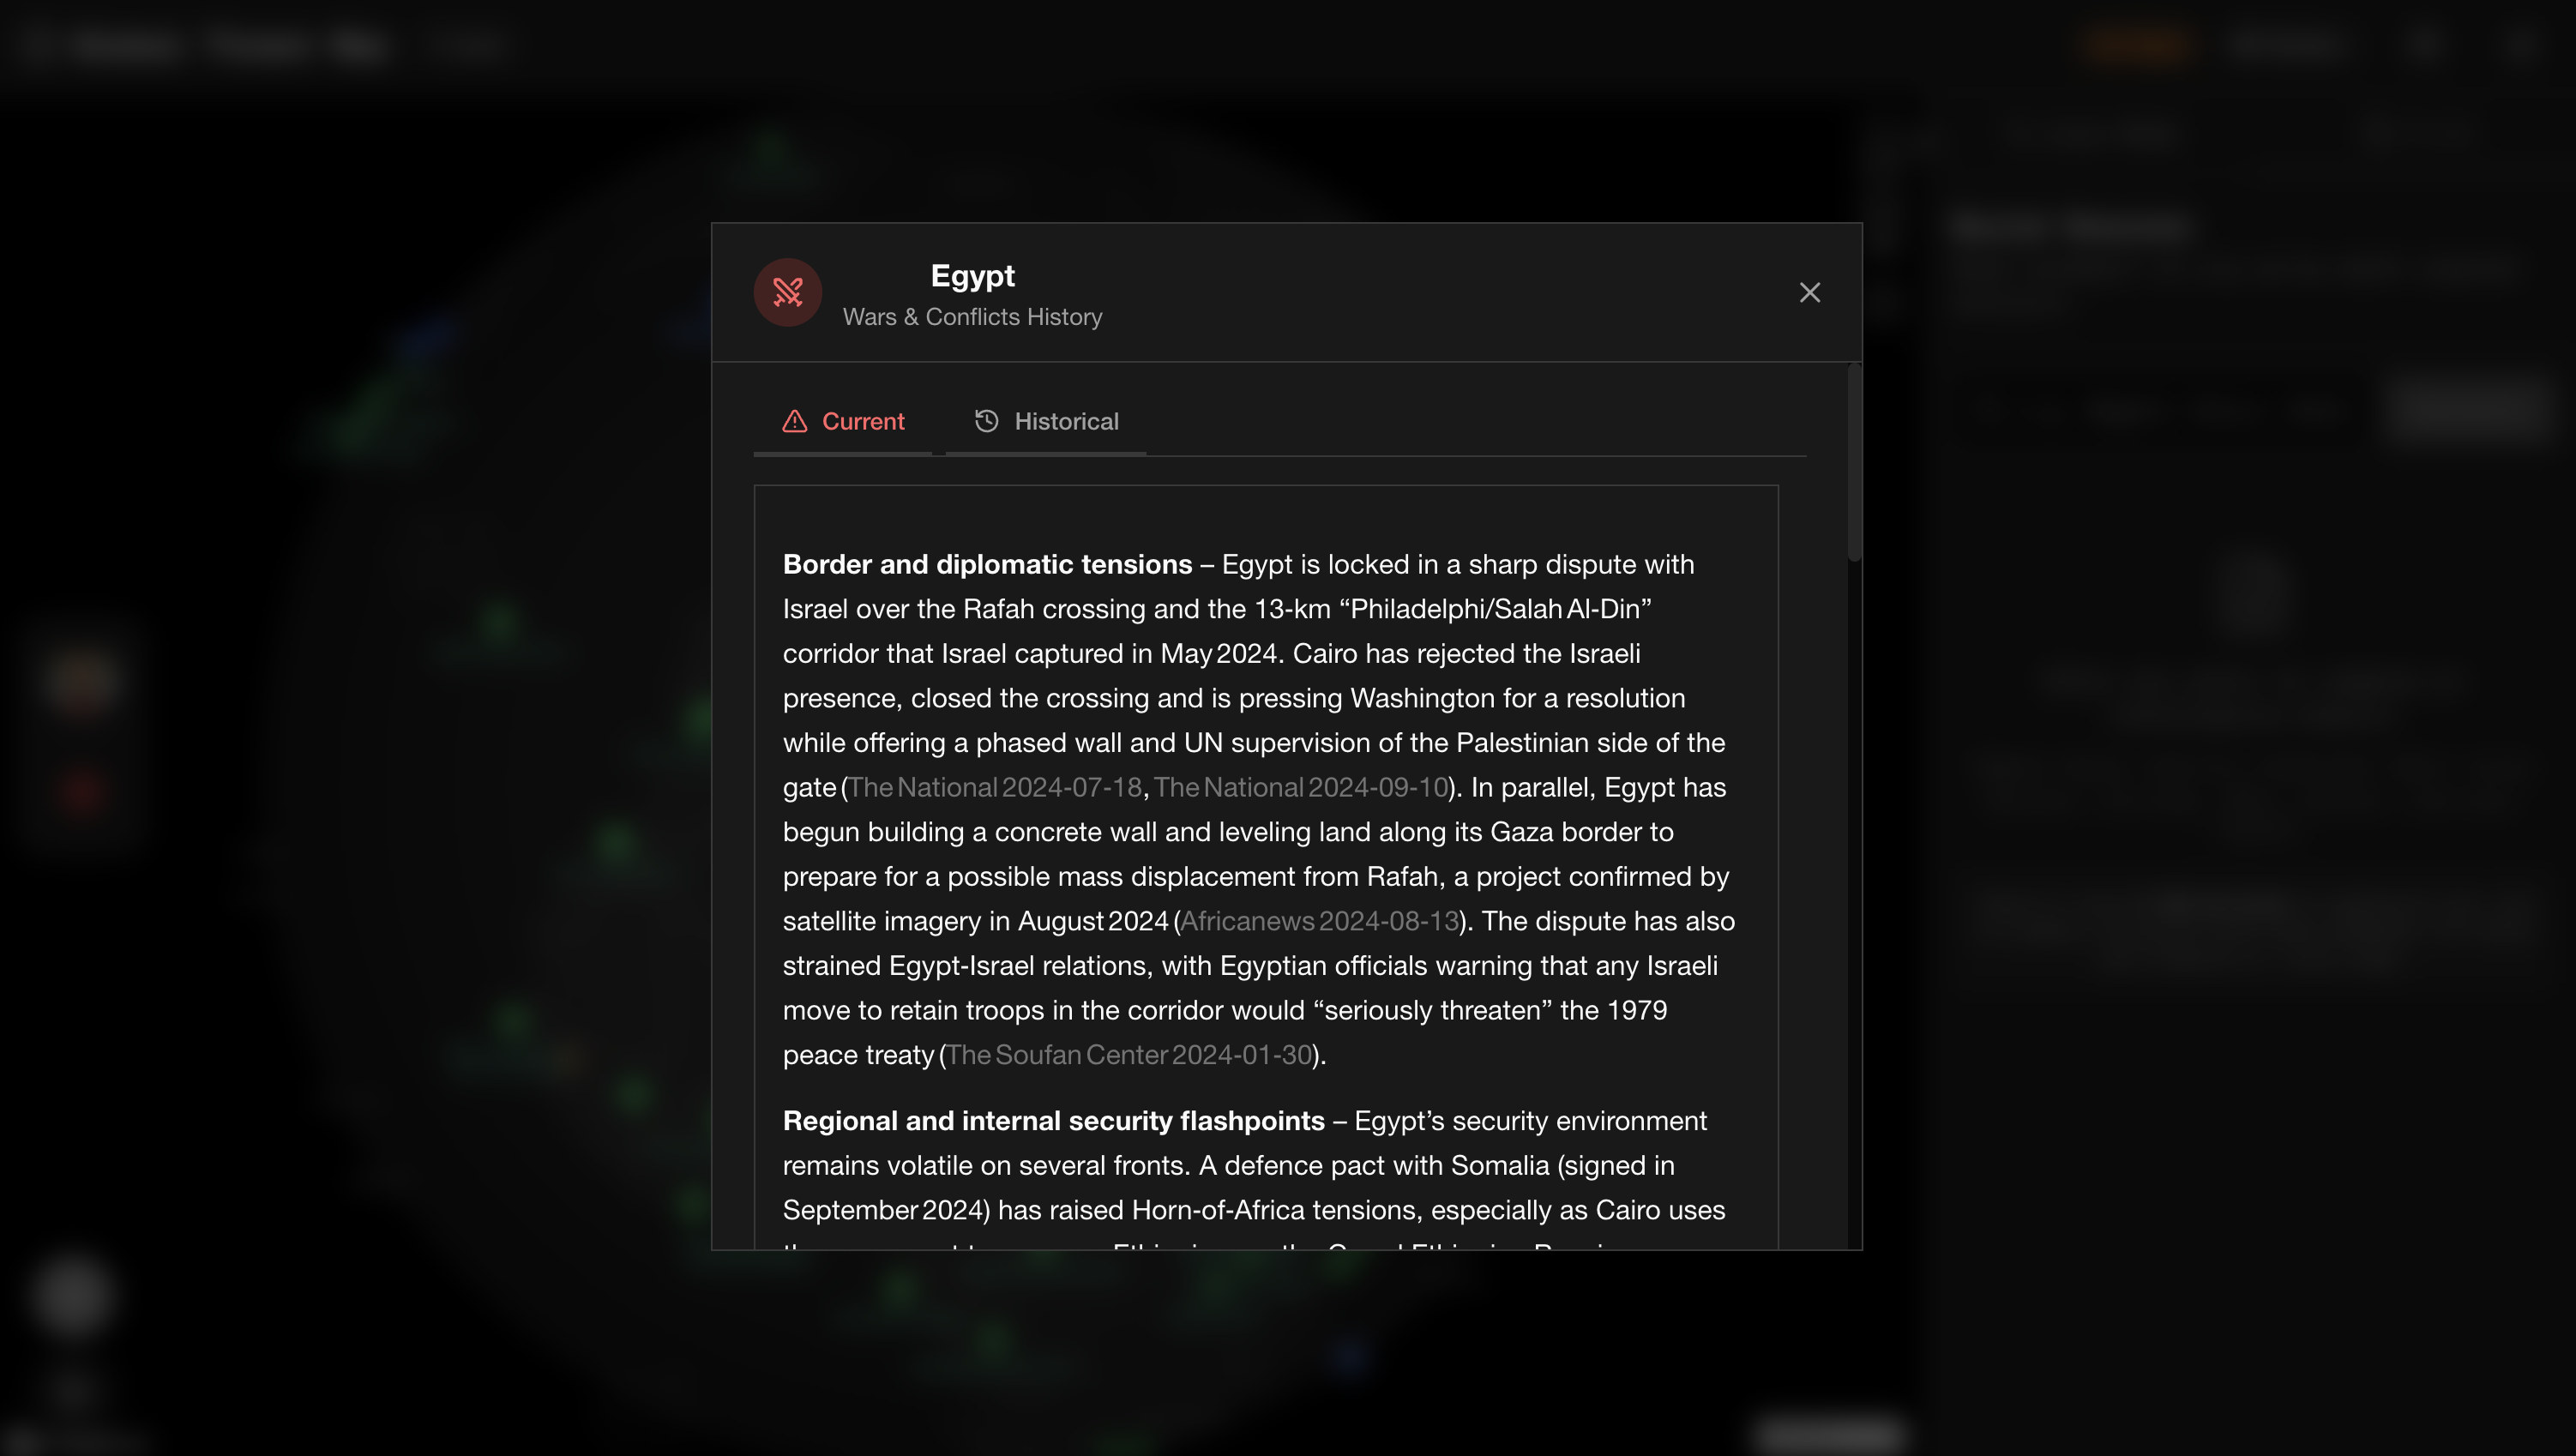
- Historical context on country click. Select a country on the map, and the app pulls up two lists: current conflicts and historical wars with dates and outcomes.
- Entity dossiers. You can enter an organization, PMC, or political figure name to generate a deep analytical report with structured CSV export and PowerPoint presentation.
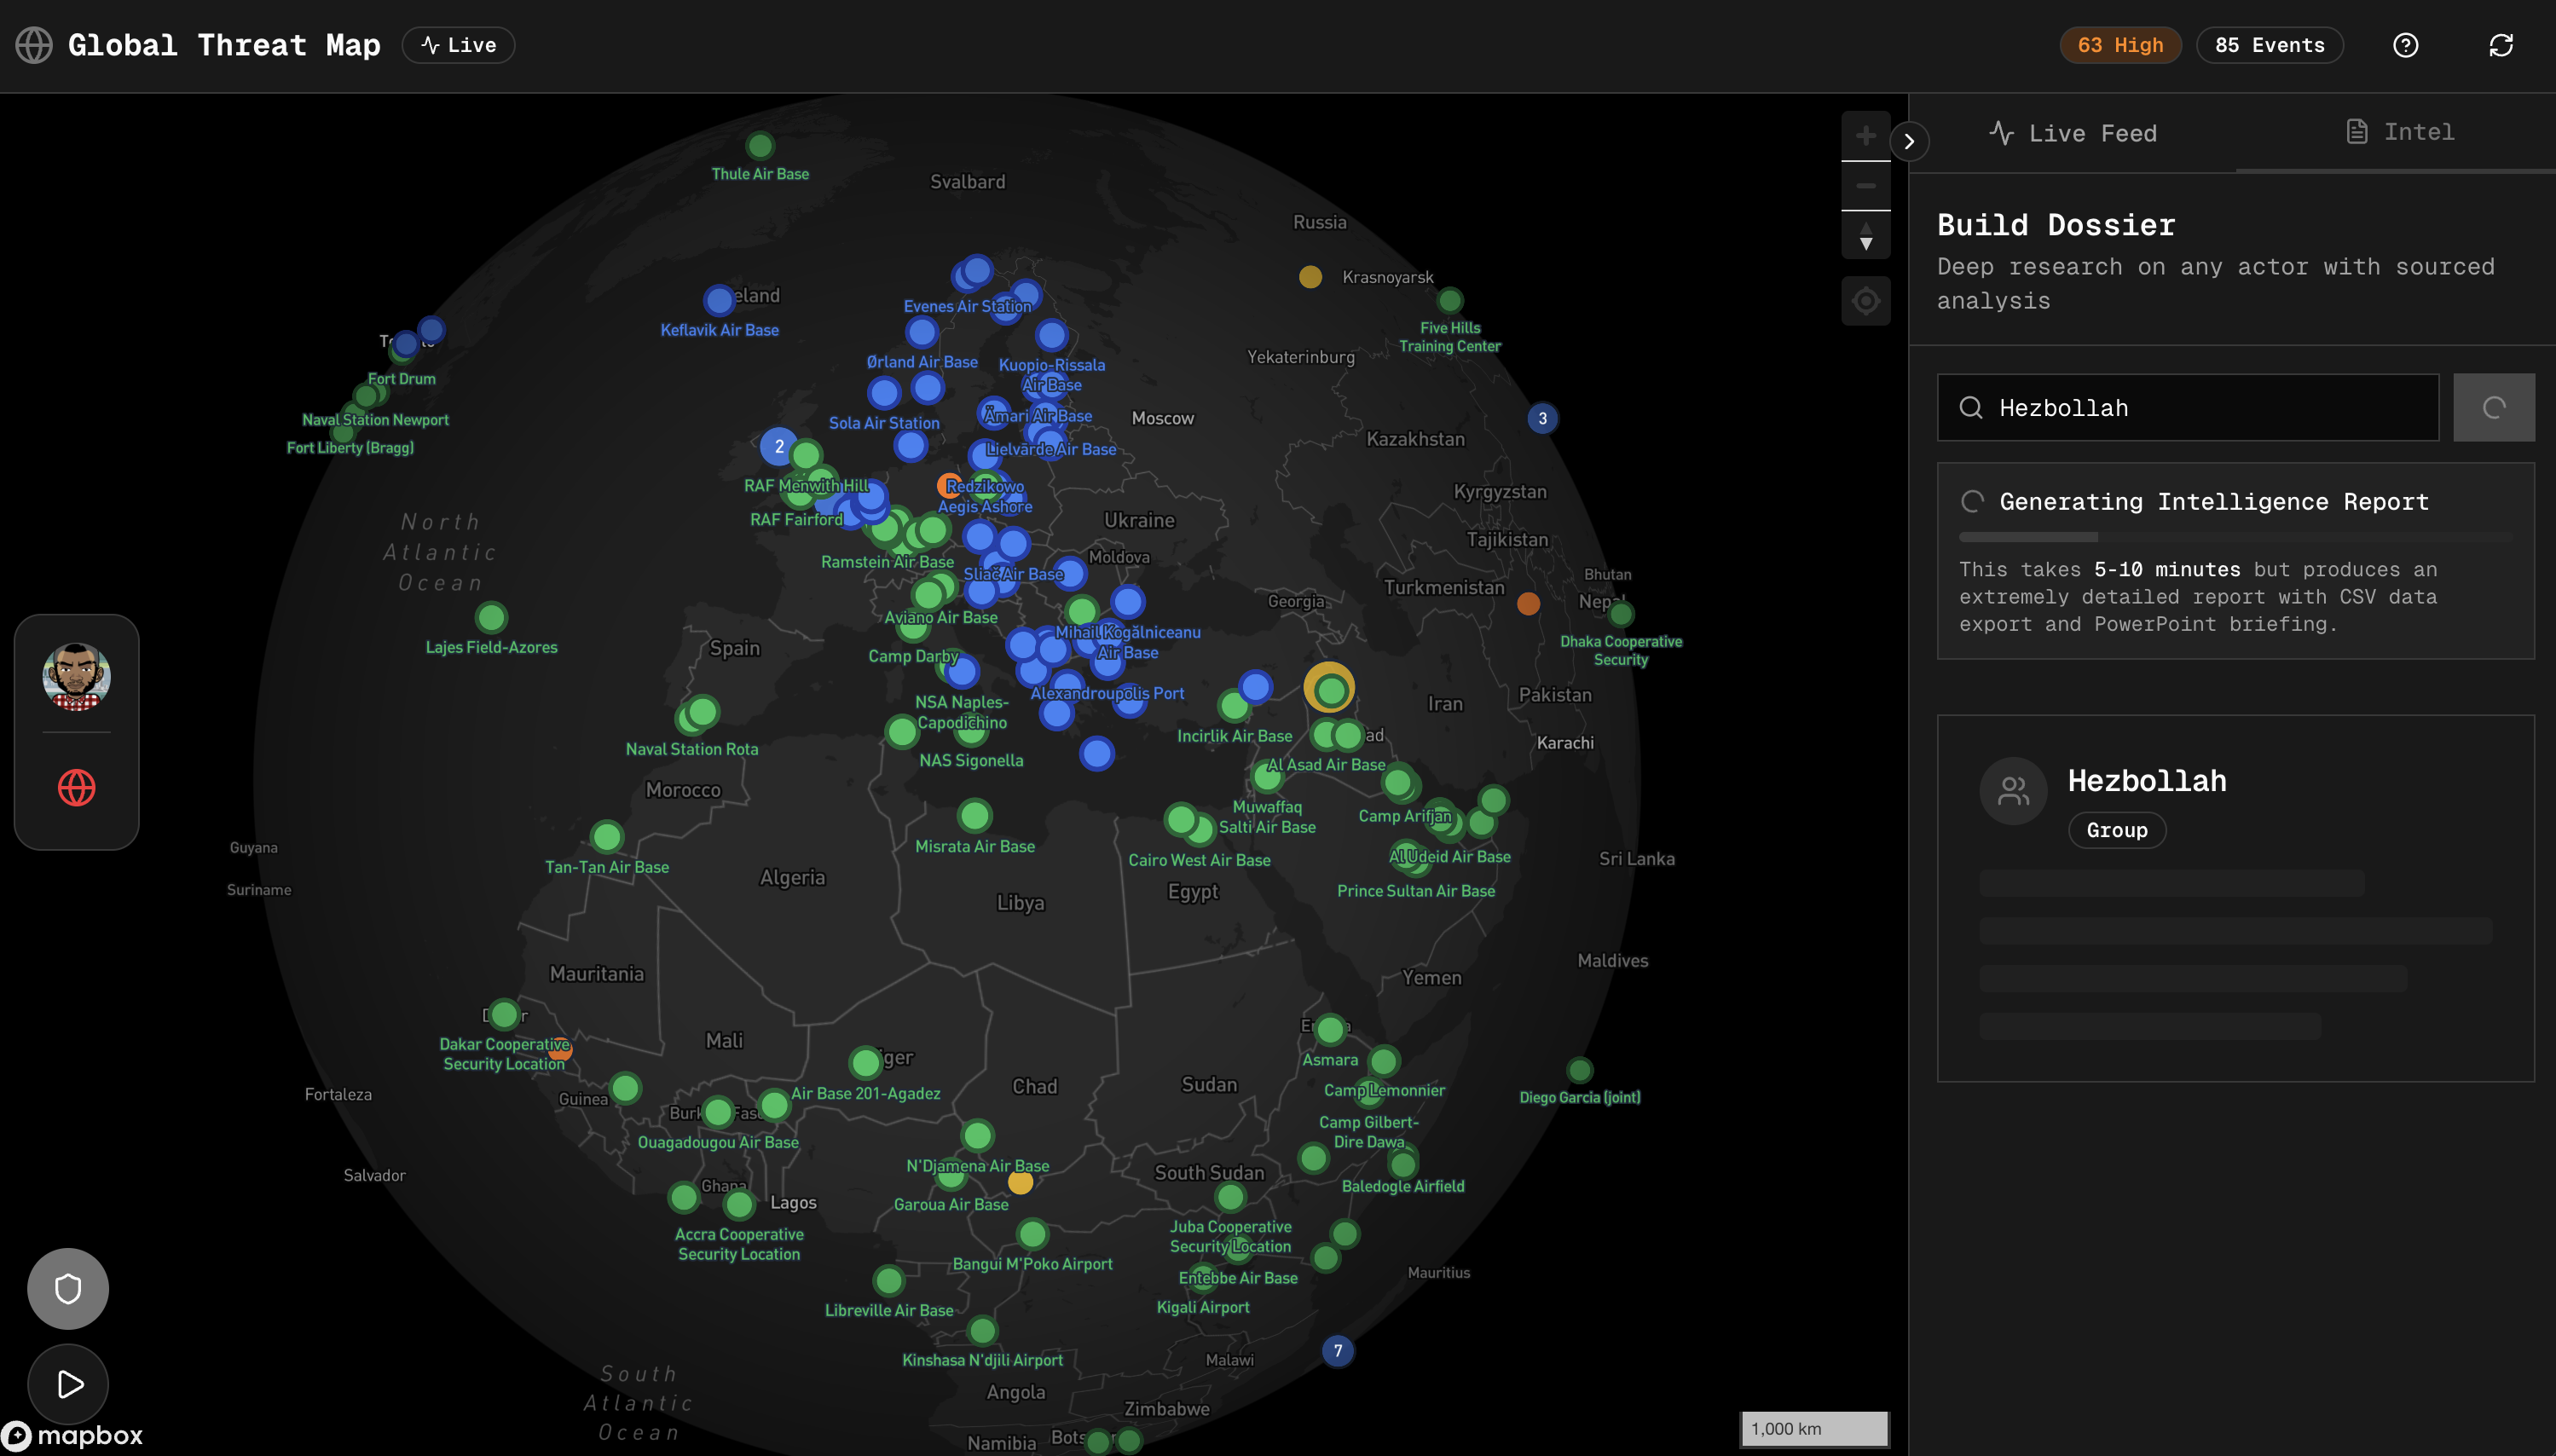
An interesting detail: when generating analytics, the project deliberately excludes Wikipedia from search sources, relying on external news summaries and reports via the Valyu Answer API.
Architecture and Tech Stack
From a technical standpoint, the project is written cleanly and modernly. Under the hood, it uses a fresh stack:
- Next.js 16 with App Router as the application foundation
- Mapbox GL JS and react-map-gl for vector map rendering
- Tailwind CSS v4 for interface styling
- Valyu API (client
valyu-js) for event search, answer generation, and in-depth research - Zustand for client-side map state management
- Zod for validating incoming data schemas
The application supports two operating modes: self-hosted (fully autonomous deployment with your own API key) and authorization mode via Valyu OAuth.
The directory structure follows standard Next.js patterns:
globalthreatmap/
├── app/
│   ├── page.tsx                # Главный дашборд
│   └── api/                    # Роуты для событий, отчетов и баз
├── components/
│   ├── map/                    # Компоненты карты и модалок
│   ├── feed/                   # Лента событий
│   └── search/                 # Поиск по сущностям
├── lib/
│   ├── valyu.ts                # Интеграция с Valyu API
│   └── geocoding.ts            # Извлечение геокоординат
└── stores/
    └── map-store.ts            # Стейт карты в Zustand
How to Deploy Locally
You'll need Node.js 18+ and API keys for Mapbox and Valyu services to get started. Optionally, you can add an OpenAI key to enable more accurate geolocation extraction from text.

Clone the repository and install dependencies:
git clone https://github.com/unicodeveloper/globalthreatmap.git
cd globalthreatmap
npm install
Create a .env.local file in the project root:
NEXT_PUBLIC_MAPBOX_TOKEN=your_mapbox_token_here
VALYU_API_KEY=your_valyu_api_key_here
NEXT_PUBLIC_APP_MODE=self-hosted

# Опционально: улучшенный парсинг локаций через OpenAI
OPENAI_API_KEY=your_openai_api_key_here
Start the local development server:
npm run dev
After that, the interface will be accessible at http://localhost:3000.
Thoughts and Conclusions
The project is interesting as a ready-made example of a complex geo-interface built with React. If you're planning to develop your own event tracker, infrastructure monitoring dashboard, or OSINT analytics tool, you can find useful patterns here for working with Mapbox GL and frontend state.
A note to keep in mind: generating detailed 50-page dossiers via Deep Research takes 5 to 10 minutes, as the API queries hundreds of sources. But for initial fact-gathering tasks, this is a perfectly viable option. The source code is open under the MIT license, so you can freely take the map and geocoding modules for your own pet projects.
Related projects